Wyomissing: Fire Incidents, Pennsylvania (PA)
Where are fire incidents reported in Wyomissing, PA
Something went wrong! Please refresh the page.
| Fire incidents reported | |
|---|---|
| Sreet name | Count |
| PAPERMILL RD | 204 |
| PARK RD | 92 |
| WOODLAND RD | 86 |
| STATE HILL RD | 70 |
| BERKSHIRE BLVD | 68 |
| PENN AVE | 60 |
| OLD MILL RD | 56 |
| CAMBRIDGE AVE | 52 |
| TULPEHOCKEN RD | 48 |
| WYOMISSING BLVD | 42 |
| 422 RT | 38 |
| MERIDIAN BLVD | 34 |
| READING BLVD | 32 |
| RIDGEWOOD RD | 28 |
| CROSSING DR | 26 |
| WELLINGTON BLVD | 26 |
| 222 RT | 24 |
| COMMERCE DR | 24 |
| NORTH PARK RD | 24 |
| CLEVELAND AVE | 22 |
| MUSEUM RD | 20 |
| NORTH MERIDIAN BLVD | 20 |
| VALLEY RD | 20 |
| SPRING ST | 18 |
| BROADCASTING (C P) RD | 16 |
| BROADCASTING RD | 16 |
| GREENBRIAR RD | 16 |
| VAN REED RD | 16 |
| FRANKLIN PL | 14 |
| DELAWARE AVE | 12 |
2004 - 2018 National Fire Incident Reporting System (NFIRS) incidents
- Incident types reported to NFIRS in Wyomissing, PA
- 94023.5%Fire
- 76619.1%Hazardous Condition
- 76219.0%Rescue & EMS
- 66016.5%False Alarm
- 3729.3%Good Intent Call
- 3208.0%Special Incident
- 1664.1%Service Call
- 100.2%Overpressure Rupture
- 60.1%Severe Weather
- Fire incident types reported to NFIRS in Wyomissing, PA
- 45848.7%Structure Fires
- 29030.9%Outside Fires
- 13914.8%Mobile Property/Vehicle Fires
- 535.6%Other
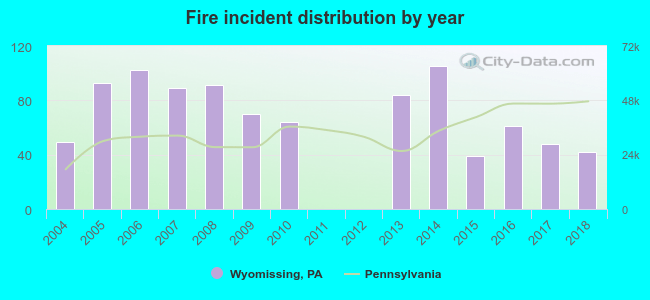 According to the data from the years 2004 - 2018 the average number of fires per year is 62. The highest number of fires - 105 took place in 2014, and the least - 0 in 2011. The data has a decreasing trend.
The average number of yearly fire incidents per 10k residents in Wyomissing, PA compared to nearest cities:
(Note: Based on data for the last 3 years, including only cities with population 5,000 and above)
| Wyomissing: | 48.1 |
| Shillington: | 50.7 |
| Reading: | 69.4 |
| Blandon: | 4.9 |
| Birdsboro: | 87.4 |
| Ephrata: | 53.0 |
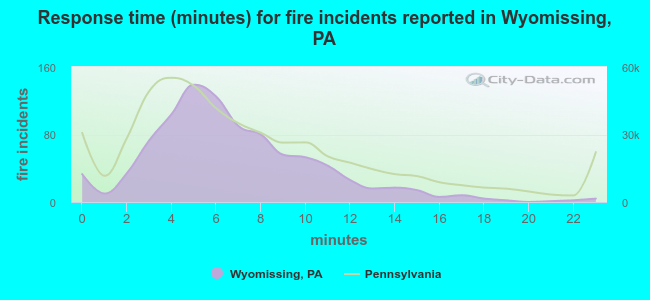 The median response time based on all reported fire incidents is 6 minutes. This is similar to the state median value.
The median response time in Wyomissing, PA compared to nearest cities:
(Note: Based on data for all years, including only cities with at least 500 fire incidents)
| Wyomissing: | 6 minutes |
| Reading: | 3 minutes |
| Sinking Spring: | 6 minutes |
| Mohnton: | 9 minutes |
| Leesport: | 10 minutes |
| Birdsboro: | 9 minutes |
| Bernville: | 9 minutes |
| Denver: | 9 minutes |
| Fleetwood: | 8 minutes |
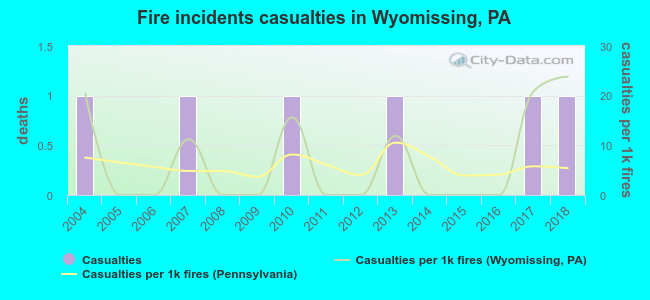 Based on the reports from the years 2004 - 2018 the average number of fire-related casualties per year is 0. The highest number of injuries - 1 took place in 2004, and the lowest - 0 in 2005. The data has a constant trend.
The average number of casualties per 1,000 fires is 7. This indicator was the highest - 24 in 2018, and the lowest 0 in 2005. The trend for casualties per 1,000 incidents is growing. Compared to the state value the number of casualties per 1,000 incidents is about the same.
Based on the reports from the years 2004 - 2018 the average number of fire-related casualties per year is 0. The highest number of injuries - 1 took place in 2004, and the lowest - 0 in 2005. The data has a constant trend.
The average number of casualties per 1,000 fires is 7. This indicator was the highest - 24 in 2018, and the lowest 0 in 2005. The trend for casualties per 1,000 incidents is growing. Compared to the state value the number of casualties per 1,000 incidents is about the same.
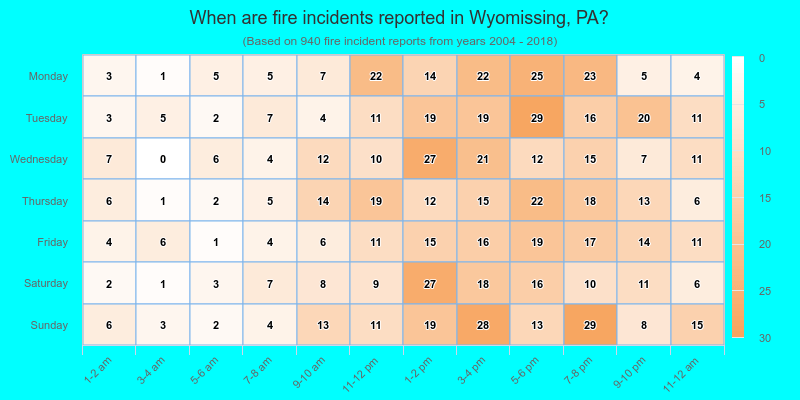
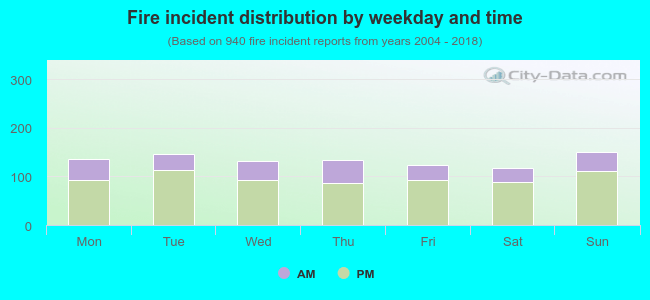 27.9% incidents where reported in the morning and 72.1% in the evening. The most fires (16.1%) took place on Sunday, and the least (12.6%) on Saturday.
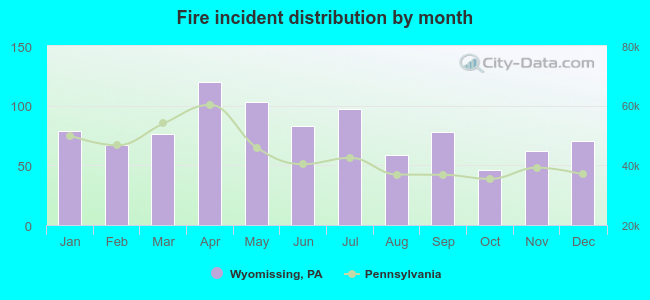 Based on the 940 fire incident reports from years 2004 - 2018 most fires (12.8%) took place during April, and the least (4.9%) in October.
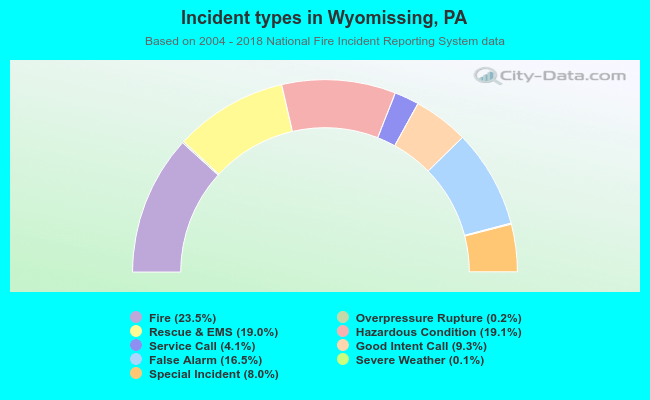 Out of all 4,002 cases reported during the years 2004 - 2018, the most belonged to the categories: Fire (23.5%), Hazardous Condition (19.1%), and Rescue & EMS (19.0%).
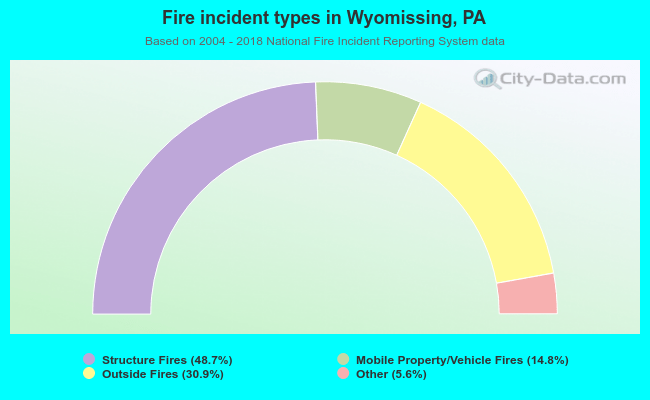 When looking into fire subcategories, the most incidents belonged to: Structure Fires (48.7%), and Outside Fires (30.9%).