Windsor: Fire Incidents, Connecticut (CT)
Where are fire incidents reported in Windsor, CT
Something went wrong! Please refresh the page.
| Fire incidents reported | |
|---|---|
| Sreet name | Count |
| I91 HWY | 172 |
| POQUONOCK AVE | 158 |
| WINDSOR AVE | 156 |
| BLOOMFIELD AVE | 86 |
| PALISADO AVE | 80 |
| BROAD ST | 64 |
| DAY HILL RD | 62 |
| DEERFIELD RD | 58 |
| MATIANUCK AVE | 58 |
| HIGH PATH RD | 54 |
| MACK ST | 46 |
| KENNEDY RD | 42 |
| PARK AVE | 38 |
| I-91 HWY | 36 |
| INTERNATIONAL DR | 34 |
| BREWSTER RD | 32 |
| MARSHALL PHELPS RD | 32 |
| PINE LN | 32 |
| MERRIMAN RD | 30 |
| PORTMAN ST | 30 |
| RAINBOW RD | 28 |
| HENRY ST | 26 |
| PROSPECT HILL RD | 26 |
| ADDISON RD | 24 |
| ARROWBROOK RD | 24 |
| BARBER ST | 24 |
| CONESTOGA ST | 24 |
| HIGHLAND AVE | 24 |
| SAGE PARK RD | 22 |
| WOODLAND ST | 22 |
| Other | 241 |
2004 - 2018 National Fire Incident Reporting System (NFIRS) incidents
- Incident types reported to NFIRS in Windsor, CT
- 1,78529.5%Fire
- 1,43223.6%Hazardous Condition
- 1,00216.5%Rescue & EMS
- 83113.7%False Alarm
- 74112.2%Good Intent Call
- 2554.2%Service Call
- 90.1%Overpressure Rupture
- Fire incident types reported to NFIRS in Windsor, CT
- 99956.0%Structure Fires
- 35820.1%Outside Fires
- 34919.6%Mobile Property/Vehicle Fires
- 794.4%Other
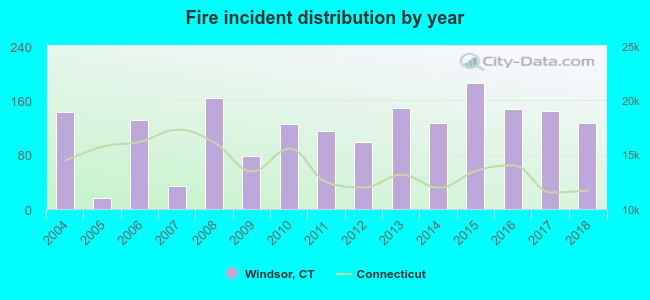 Based on the data from the years 2004 - 2018 the average number of fire incidents per year is 119. The highest number of fires - 185 took place in 2015, and the least - 16 in 2005. The data has a dropping trend.
The average number of yearly fire incidents per 10k residents in Windsor, CT compared to nearest cities:
(Note: Based on data for the last 3 years, including only cities with population 5,000 and above)
| Windsor: | 48.0 |
| Bloomfield: | 50.8 |
| Windsor Locks: | 41.3 |
| South Windsor: | 16.3 |
| East Windsor: | 4.8 |
| East Granby: | 93.2 |
| Hartford: | 39.1 |
| East Hartford: | 37.3 |
| Simsbury: | 16.0 |
 The median response time based on all reported fire incidents is 6 minutes. This is about the same as the Connecticut median value.
The median response time in Windsor, CT compared to nearest cities:
(Note: Based on data for all years, including only cities with at least 500 fire incidents)
| Windsor: | 6 minutes |
| Bloomfield: | 6 minutes |
| Windsor Locks: | 6 minutes |
| South Windsor: | 7 minutes |
| East Granby: | 7 minutes |
| Hartford: | 4 minutes |
| East Hartford: | 4 minutes |
| Simsbury: | 5 minutes |
| West Hartford: | 4 minutes |
 33.1% incidents where reported in the morning and 66.9% in the evening. The most fires (15.5%) took place on Monday, and the least (13.5%) on Tuesday.
 Based on the 1,785 reports from years 2004 - 2018 most fires (10.4%) took place during April, and the least (5.1%) in December.
 Out of all 6,057 cases reported during the years 2004 - 2018, the most belonged to the categories: Fire (29.5%), Hazardous Condition (23.6%), and Rescue & EMS (16.5%).
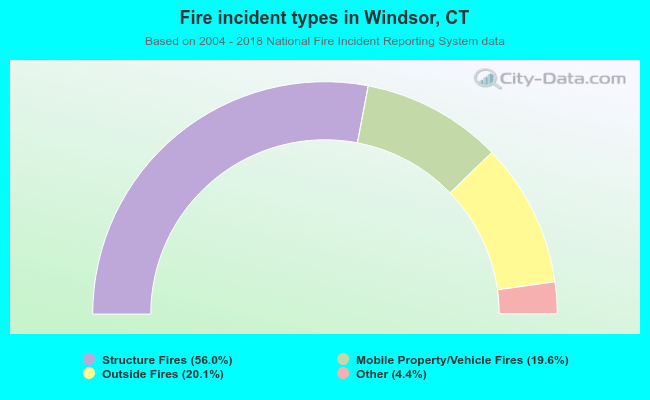 When looking into fire subcategories, the most incidents belonged to: Structure Fires (56.0%), and Outside Fires (20.1%).