Whitehall: Fire Incidents, Ohio (OH)
Where are fire incidents reported in Whitehall, OH
Something went wrong! Please refresh the page.
| Fire incidents reported | |
|---|---|
| Sreet name | Count |
| BROAD ST | 246 |
| MAIN ST | 244 |
| HAMILTON RD | 164 |
| YEARLING RD | 86 |
| RICKENBACKER AVE | 54 |
| FAIRWAY BLVD | 40 |
| WESTPHAL AVE | 38 |
| ROBINWOOD AVE | 34 |
| ETNA RD | 32 |
| WOODCLIFF DR | 30 |
| IRONGATE LN | 26 |
| LONGBRANCH LN | 24 |
| ST FRANCIS LN | 24 |
| DIMSON DR | 20 |
| MOUND ST | 20 |
| BARKLEY PL | 18 |
| COLLINGWOOD AVE | 18 |
| EXETER RD | 16 |
| MIDCLIFF DR | 16 |
| PARKLAWN BLVD | 16 |
| POTH RD | 16 |
| BEECHBANK RD | 14 |
| POWELL AVE | 14 |
| SAN JOSE LN | 14 |
| ANDRUS CT | 12 |
| BEECHWOOD RD | 12 |
| COUNTRY CLUB RD | 12 |
| DONEY ST | 12 |
| KAE AVE | 12 |
| MAPLEWOOD AVE | 12 |
2005 - 2018 National Fire Incident Reporting System (NFIRS) incidents
- Incident types reported to NFIRS in Whitehall, OH
- 15,27268.0%Rescue & EMS
- 2,94113.1%Good Intent Call
- 1,3836.2%Hazardous Condition
- 9974.4%Service Call
- 9124.1%Fire
- 8884.0%False Alarm
- 530.2%Special Incident
- Fire incident types reported to NFIRS in Whitehall, OH
- 47251.8%Structure Fires
- 28831.6%Outside Fires
- 14816.2%Mobile Property/Vehicle Fires
- 40.4%Other
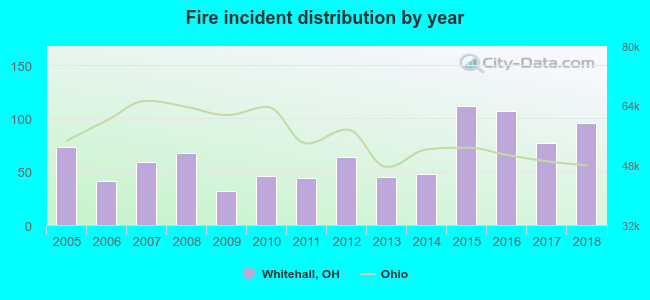 Based on the data from the years 2005 - 2018 the average number of fire incidents per year is 65. The highest number of reported fires - 112 took place in 2015, and the least - 32 in 2009. The data has a rising trend.
The average number of yearly fire incidents per 10k residents in Whitehall, OH compared to nearest cities:
(Note: Based on data for the last 3 years, including only cities with population 5,000 and above)
| Whitehall: | 50.3 |
| Bexley: | 9.6 |
| Reynoldsburg: | 28.7 |
| Gahanna: | 20.2 |
| Columbus: | 38.2 |
| Groveport: | 111.7 |
| Pickerington: | 30.2 |
| Grandview Heights: | 16.1 |
| New Albany: | 42.0 |
 The median response time based on all reported fire incidents is 4 minutes. This is lower than the Ohio median value.
The median response time in Whitehall, OH compared to nearest cities:
(Note: Based on data for all years, including only cities with at least 500 fire incidents)
| Whitehall: | 4 minutes |
| Reynoldsburg: | 6 minutes |
| Gahanna: | 5 minutes |
| Columbus: | 4 minutes |
| Groveport: | 5 minutes |
| Pickerington: | 6 minutes |
| Canal Winchester: | 5 minutes |
| Pataskala: | 7 minutes |
| Upper Arlington: | 5 minutes |
 Based on the reports from the years 2005 - 2018 the average number of fire-related yearly deaths is 0. The highest number of reported deaths - 1 took place in 2005, and the lowest - 0 in 2006. The data has a constant trend.
 According to the data from the years 2005 - 2018 the average number of fire-related casualties per year is 1. The highest number of injuries - 2 took place in 2005, and the lowest - 0 in 2006. The data has a declining trend.
The average number of casualties per 1,000 fire incidents is 10. This indicator was the highest - 43 in 2010, and the lowest 0 in 2006. The trend for injuries per 1,000 fire incidents is decreasing. Compared to the state value the number of injuries per 1,000 fires is lower.
According to the data from the years 2005 - 2018 the average number of fire-related casualties per year is 1. The highest number of injuries - 2 took place in 2005, and the lowest - 0 in 2006. The data has a declining trend.
The average number of casualties per 1,000 fire incidents is 10. This indicator was the highest - 43 in 2010, and the lowest 0 in 2006. The trend for injuries per 1,000 fire incidents is decreasing. Compared to the state value the number of injuries per 1,000 fires is lower.Casualties per 1,000 incidents in Whitehall, OH compared to nearest cities:
(Note: Based on data for all years, including only cities with at least 500 fire incidents)
| Whitehall: | 9.9 |
| Reynoldsburg: | 22.3 |
| Gahanna: | 7.5 |
| Columbus: | 13.4 |
| Groveport: | 14.2 |
| Pickerington: | 15.8 |
| Canal Winchester: | 5.9 |
| Pataskala: | 22.3 |
| Upper Arlington: | 15.7 |
 29.2% incidents where reported in the morning and 70.8% in the evening. The most fires (16.6%) took place on Sunday, and the least (11.4%) on Monday.
 According to the 912 fires from years 2005 - 2018 most fires (12.2%) took place during April, and the least (5.9%) in December.
 Out of all 22,465 cases reported during the years 2005 - 2018, the most belonged to the categories: Rescue & EMS (68.0%), Good Intent Call (13.1%), and Hazardous Condition (6.2%).
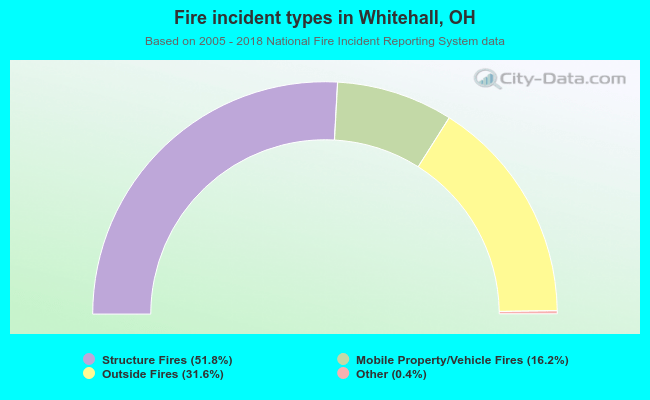 When looking into fire subcategories, the most incidents belonged to: Structure Fires (51.8%), and Outside Fires (31.6%).