Westport: Fire Incidents, Connecticut (CT)
Where are fire incidents reported in Westport, CT
Something went wrong! Please refresh the page.
| Fire incidents reported | |
|---|---|
| Sreet name | Count |
| POST RD | 310 |
| COMPO RD | 70 |
| WILTON RD | 54 |
| MAIN ST | 44 |
| EASTON RD | 38 |
| GREENS FARMS RD | 34 |
| I95 NB 18-19 | 28 |
| NORTH AV | 28 |
| RIVERSIDE AVE | 28 |
| KINGS HWY | 26 |
| HILLSPOINT RD | 24 |
| RAILROAD PL | 24 |
| SYLVAN RD | 24 |
| OLD RD | 22 |
| SAUGATUCK AVE | 22 |
| JESUP RD | 20 |
| PARTRICK RD | 20 |
| RIVERSIDE AV | 20 |
| ROSEVILLE RD | 20 |
| WESTON RD | 20 |
| CROSS HWY | 18 |
| FERRY LA | 18 |
| I95 SB 18-17 | 18 |
| IMPERIAL AVE | 18 |
| MORNINGSIDE DR | 18 |
| NORTH AVE | 18 |
| RT15 NB 4244 | 18 |
| BAYBERRY LN | 16 |
| HIGH POINT RD | 16 |
| I95 NB 17-18 | 16 |
| Other | 642 |
2002 - 2018 National Fire Incident Reporting System (NFIRS) incidents
- Incident types reported to NFIRS in Westport, CT
- 7,95033.8%Hazardous Condition
- 4,89020.8%False Alarm
- 4,49219.1%Rescue & EMS
- 2,77411.8%Service Call
- 1,6927.2%Fire
- 1,4936.3%Good Intent Call
- 1100.5%Special Incident
- 800.3%Overpressure Rupture
- 540.2%Severe Weather
- Fire incident types reported to NFIRS in Westport, CT
- 84850.1%Structure Fires
- 49729.4%Outside Fires
- 29217.3%Mobile Property/Vehicle Fires
- 553.3%Other
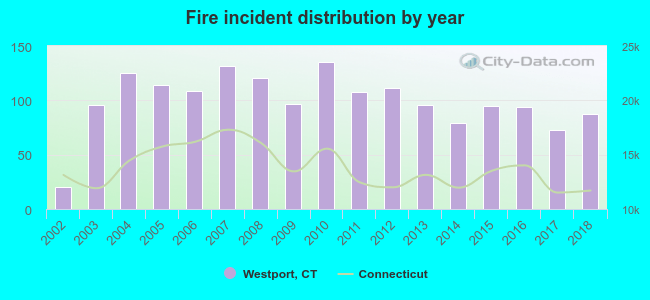 Based on the data from the years 2002 - 2018 the average number of fire incidents per year is 100. The highest number of fire incidents - 135 took place in 2010, and the least - 20 in 2002. The data has a rising trend.
The average number of yearly fire incidents per 10k residents in Westport, CT compared to nearest cities:
(Note: Based on data for the last 3 years, including only cities with population 5,000 and above)
| Westport: | 32.1 |
| Norwalk: | 29.7 |
| Fairfield: | 22.6 |
| Weston: | 20.6 |
| Wilton: | 24.5 |
| New Canaan: | 22.5 |
| Darien: | 23.6 |
| Easton: | 34.3 |
| Bridgeport: | 30.2 |
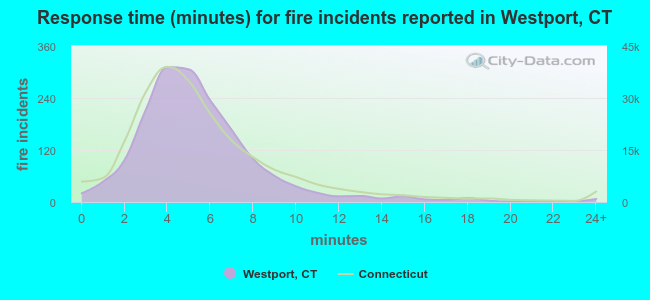 The median response time based on all reported fire incidents is 5 minutes. This is close to the state median value.
The median response time in Westport, CT compared to nearest cities:
(Note: Based on data for all years, including only cities with at least 500 fire incidents)
| Westport: | 5 minutes |
| Norwalk: | 6 minutes |
| Fairfield: | 6 minutes |
| Weston: | 6 minutes |
| Wilton: | 6 minutes |
| New Canaan: | 6 minutes |
| Darien: | 7 minutes |
| Bridgeport: | 4 minutes |
| Stamford: | 4 minutes |
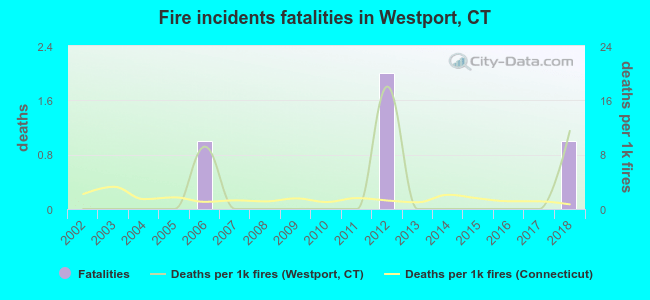 Based on the reports from the years 2002 - 2018 the average number of fire-related fatalities per year is 0. The highest number of reported deaths - 2 took place in 2012, and the lowest - 0 in 2002. The data has an increasing trend.
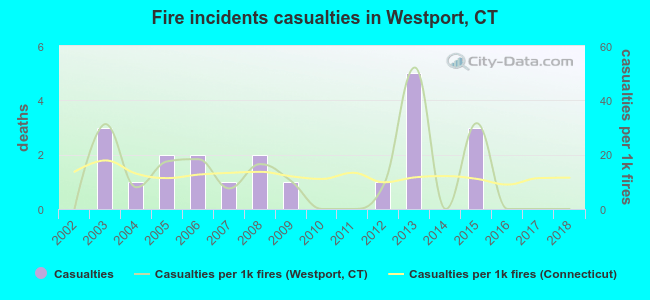 According to the reports from the years 2002 - 2018 the average number of fire-related casualties per year is 1. The highest number of reported casualties - 5 took place in 2013, and the lowest - 0 in 2002. The data has a constant trend.
The average number of injuries per 1,000 fire incidents is 12. This indicator was the highest - 52 in 2013, and the lowest 0 in 2002. The trend for casualties per 1,000 fires is constant. Compared to the state value the number of injuries per 1,000 incidents is about the same.
According to the reports from the years 2002 - 2018 the average number of fire-related casualties per year is 1. The highest number of reported casualties - 5 took place in 2013, and the lowest - 0 in 2002. The data has a constant trend.
The average number of injuries per 1,000 fire incidents is 12. This indicator was the highest - 52 in 2013, and the lowest 0 in 2002. The trend for casualties per 1,000 fires is constant. Compared to the state value the number of injuries per 1,000 incidents is about the same.Casualties per 1,000 incidents in Westport, CT compared to nearest cities:
(Note: Based on data for all years, including only cities with at least 500 fire incidents)
| Westport: | 12.4 |
| Norwalk: | 7.0 |
| Fairfield: | 21.6 |
| Weston: | 1.8 |
| Wilton: | 2.7 |
| New Canaan: | 10.3 |
| Darien: | 3.0 |
| Bridgeport: | 14.2 |
| Stamford: | 10.5 |
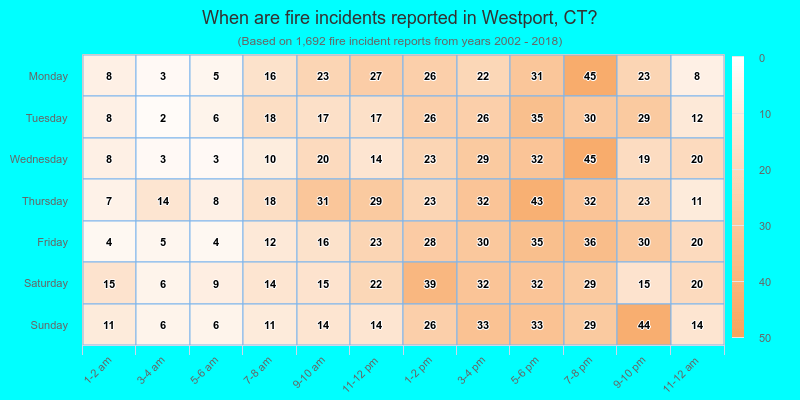
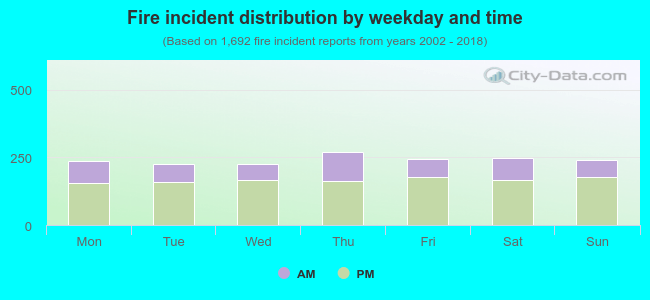 30.9% incidents where reported in the morning and 69.1% in the evening. The most fires (16.0%) took place on Thursday, and the least (13.4%) on Tuesday.
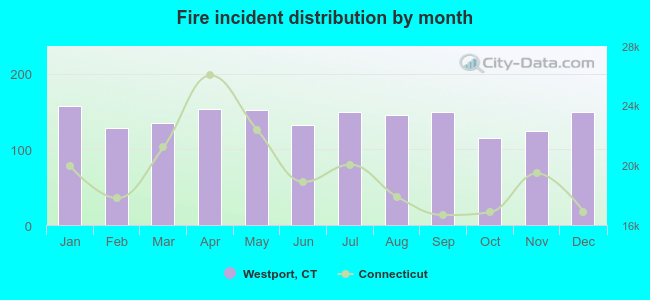 Based on the 1,692 fires from years 2002 - 2018 most fires (9.3%) took place during January, and the least (6.8%) in October.
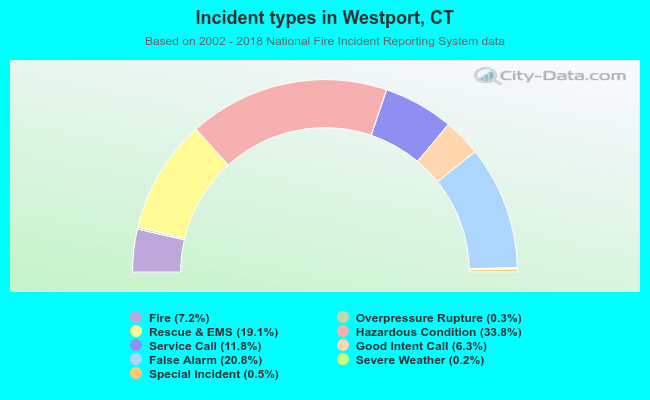 Out of all 23,535 cases reported during the years 2002 - 2018, the most belonged to the categories: Hazardous Condition (33.8%), False Alarm (20.8%), and Rescue & EMS (19.1%).
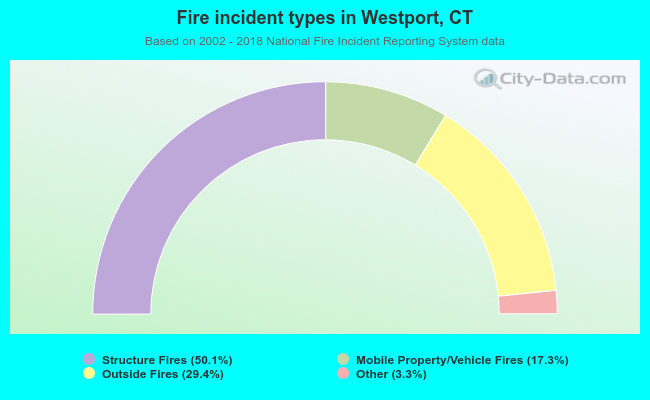 When looking into fire subcategories, the most incidents belonged to: Structure Fires (50.1%), and Outside Fires (29.4%).