Waupun: Fire Incidents, Wisconsin (WI)
Where are fire incidents reported in Waupun, WI
Something went wrong! Please refresh the page.
|
| |||||||||||||||||||||||||||||||||||||||||||||||||||||||||||||||||||||||||||||||||||||||||||||||||||||||||||||
| Other | 65 | |||||||||||||||||||||||||||||||||||||||||||||||||||||||||||||||||||||||||||||||||||||||||||||||||||||||||||||
2003 - 2018 National Fire Incident Reporting System (NFIRS) incidents
- Incident types reported to NFIRS in Waupun, WI
- 50537.3%Fire
- 34825.7%Hazardous Condition
- 15211.2%Rescue & EMS
- 14710.9%False Alarm
- 1239.1%Good Intent Call
- 664.9%Service Call
- 70.5%Special Incident
- 40.3%Overpressure Rupture
- Fire incident types reported to NFIRS in Waupun, WI
- 23947.3%Structure Fires
- 18737.0%Outside Fires
- 6212.3%Mobile Property/Vehicle Fires
- 173.4%Other
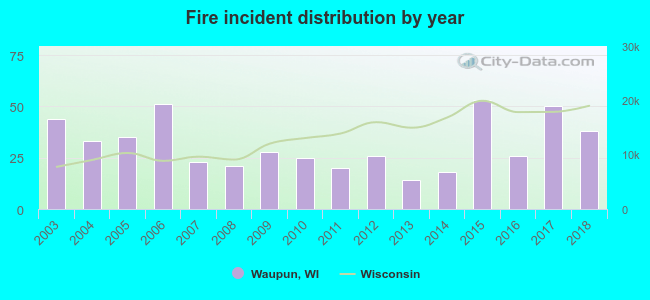 Based on the data from the years 2003 - 2018 the average number of fire incidents per year is 32. The highest number of reported fires - 53 took place in 2015, and the least - 14 in 2013. The data has a declining trend.
The average number of yearly fire incidents per 10k residents in Waupun, WI compared to nearest cities:
(Note: Based on data for the last 3 years, including only cities with population 5,000 and above)
| Waupun: | 33.4 |
| Beaver Dam: | 47.6 |
| Mayville: | 64.6 |
| Ripon: | 49.3 |
| Fond du Lac: | 34.1 |
| North Fond du Lac: | 20.6 |
| Berlin: | 50.3 |
 The median response time based on all reported fire incidents is 7 minutes. This is about the same as the Wisconsin median value.
The median response time in Waupun, WI compared to nearest cities:
(Note: Based on data for all years, including only cities with at least 500 fire incidents)
| Waupun: | 7 minutes |
| Beaver Dam: | 8 minutes |
| Fond du Lac: | 5 minutes |
 27.9% incidents where reported in the morning and 72.1% in the evening. The most fires (16.4%) took place on Friday, and the least (10.9%) on Sunday.
 Based on the 505 fire incident reports from years 2003 - 2018 most fires (19.0%) took place during April, and the least (4.0%) in December.
 Out of all 1,353 cases reported during the years 2003 - 2018, the most belonged to the categories: Fire (37.3%), Hazardous Condition (25.7%), and Rescue & EMS (11.2%).
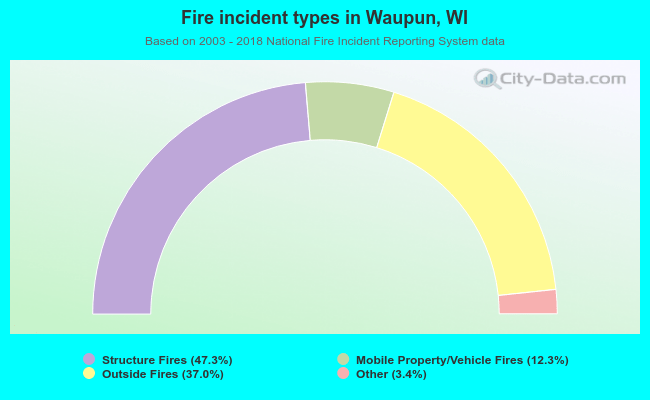 When looking into fire subcategories, the most incidents belonged to: Structure Fires (47.3%), and Outside Fires (37.0%).