Washougal: Fire Incidents, Washington (WA)
Where are fire incidents reported in Washougal, WA
Something went wrong! Please refresh the page.
| Fire incidents reported | |
|---|---|
| Sreet name | Count |
| ADDY ST | 102 |
| WASHOUGAL RIVER RD | 88 |
| C ST | 70 |
| E ST | 70 |
| A ST | 58 |
| H ST | 58 |
| G ST | 52 |
| EVERGREEN WAY | 40 |
| BLAIR RD | 38 |
| INDEX ST | 38 |
| F ST | 30 |
| 32ND ST | 28 |
| 9TH ST | 28 |
| I ST | 28 |
| K ST | 28 |
| 6TH ST | 26 |
| MAIN ST | 24 |
| 10TH ST | 22 |
| MILLER RD | 22 |
| SUNSET VIEW RD | 22 |
| 15TH ST | 20 |
| 20TH ST | 20 |
| 25TH ST | 20 |
| 34TH ST | 20 |
| GRANT ST | 20 |
| O ST | 18 |
| B ST | 16 |
| FAIRWAY DR | 16 |
| J ST | 16 |
| 17TH ST | 14 |
| Other | 154 |
2002 - 2018 National Fire Incident Reporting System (NFIRS) incidents
- Incident types reported to NFIRS in Washougal, WA
- 6,70162.2%Rescue & EMS
- 1,38512.8%Good Intent Call
- 1,20611.2%Fire
- 7947.4%Service Call
- 3693.4%Hazardous Condition
- 2922.7%False Alarm
- 230.2%Special Incident
- Fire incident types reported to NFIRS in Washougal, WA
- 51642.8%Structure Fires
- 42635.3%Outside Fires
- 15913.2%Mobile Property/Vehicle Fires
- 1058.7%Other
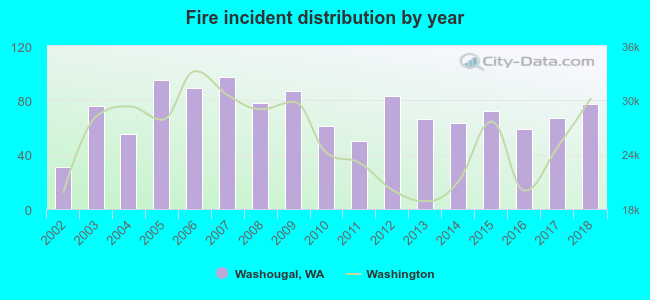 Based on the data from the years 2002 - 2018 the average number of fires per year is 71. The highest number of fire incidents - 97 took place in 2007, and the least - 31 in 2002. The data has a rising trend.
The average number of yearly fire incidents per 10k residents in Washougal, WA compared to nearest cities:
(Note: Based on data for the last 3 years, including only cities with population 5,000 and above)
| Washougal: | 45.1 |
| Camas: | 32.8 |
| Vancouver: | 40.5 |
| Hazel Dell: | 4.1 |
| Battle Ground: | 61.6 |
| Ridgefield: | 110.5 |
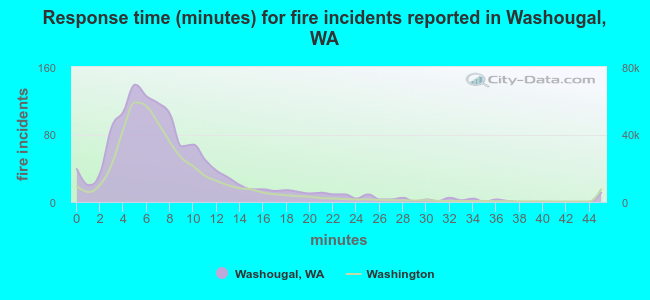 The median response time based on all reported fire incidents is 7 minutes. This is about the same as the state median value.
The median response time in Washougal, WA compared to nearest cities:
(Note: Based on data for all years, including only cities with at least 500 fire incidents)
| Washougal: | 7 minutes |
| Camas: | 7 minutes |
| Troutdale: | 5 minutes |
| Gresham: | 5 minutes |
| Vancouver: | 6 minutes |
| Happy Valley: | 5 minutes |
| Sandy: | 8 minutes |
| Brush Prairie: | 7 minutes |
| Portland: | 5 minutes |
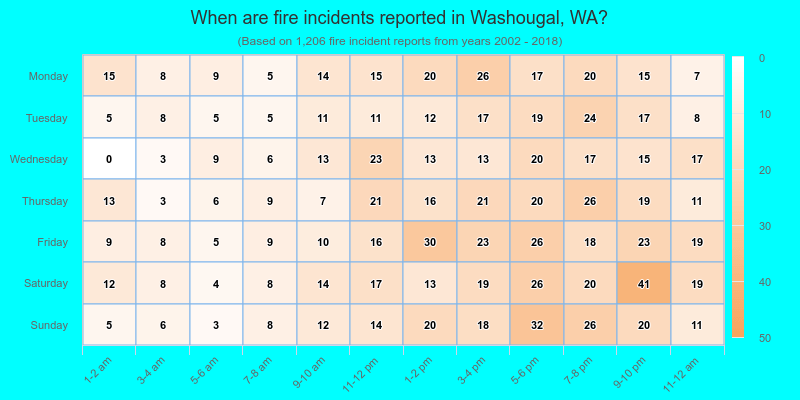
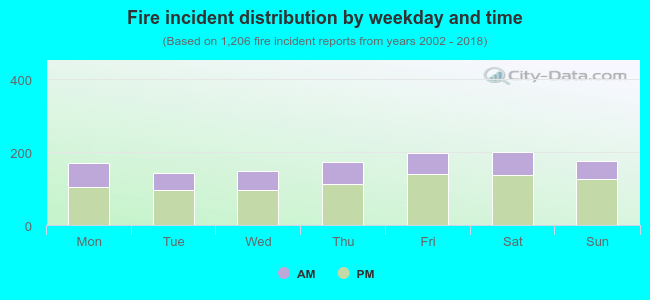 32.5% incidents where reported in the morning and 67.5% in the evening. The most fires (16.7%) took place on Saturday, and the least (11.8%) on Tuesday.
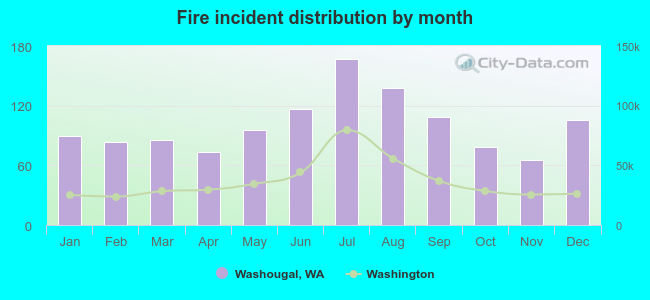 According to the 1,206 incident reports from years 2002 - 2018 most fires (13.8%) took place during July, and the least (5.4%) in November.
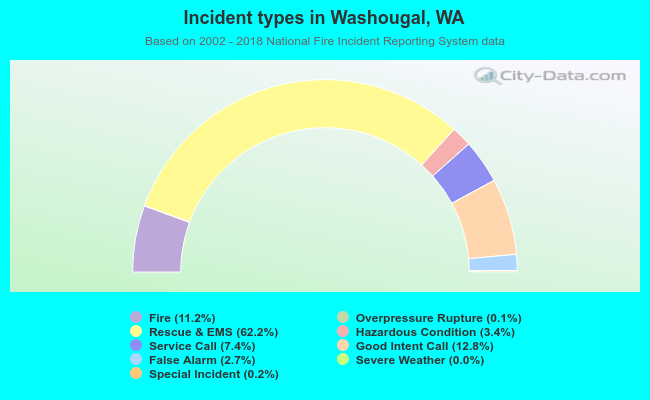 Out of all 10,780 cases reported during the years 2002 - 2018, the most belonged to the categories: Rescue & EMS (62.2%), Good Intent Call (12.8%), and Fire (11.2%).
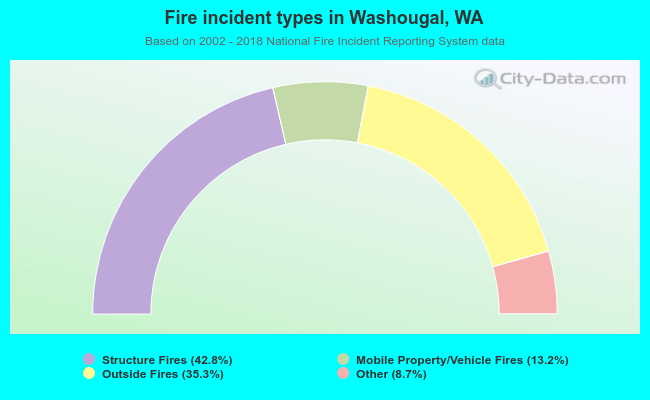 When looking into fire subcategories, the most reports belonged to: Structure Fires (42.8%), and Outside Fires (35.3%).