University Park: Fire Incidents, Texas (TX)
Where are fire incidents reported in University Park, TX
Something went wrong! Please refresh the page.
| Fire incidents reported | |
|---|---|
| Sreet name | Count |
| UNIVERSITY BLVD | 78 |
| MCFARLIN BLVD | 66 |
| HILLCREST AVE | 58 |
| BRYN MAWR DR | 46 |
| CARUTH BLVD | 42 |
| SOUTHWESTERN BLVD | 42 |
| AMHERST ST | 38 |
| HANOVER ST | 38 |
| LOVERS LN | 38 |
| ROSEDALE AVE | 38 |
| SNIDER PLZ | 38 |
| MILTON AVE | 34 |
| DANIEL AVE | 32 |
| STANFORD AVE | 32 |
| PRESTON RD | 30 |
| SMU BLVD | 30 |
| BINKLEY AVE | 26 |
| COLGATE AVE | 26 |
| ASBURY AVE | 24 |
| NORMANDY AVE | 22 |
| PURDUE ST | 22 |
| DYER ST | 20 |
| EMERSON AVE | 18 |
| GRASSMERE LN | 18 |
| GREENBRIER DR | 18 |
| POTOMAC AVE | 18 |
| RANKIN AVE | 18 |
| CENTENARY DR | 16 |
| WESTMINSTER AVE | 16 |
| BISHOP BLVD | 14 |
2002 - 2018 National Fire Incident Reporting System (NFIRS) incidents
- Incident types reported to NFIRS in University Park, TX
- 5,19830.9%Rescue & EMS
- 4,38326.1%Hazardous Condition
- 4,06924.2%False Alarm
- 1,5259.1%Service Call
- 9335.5%Good Intent Call
- 6784.0%Fire
- 180.1%Overpressure Rupture
- Fire incident types reported to NFIRS in University Park, TX
- 27240.1%Structure Fires
- 26739.4%Outside Fires
- 9213.6%Mobile Property/Vehicle Fires
- 476.9%Other
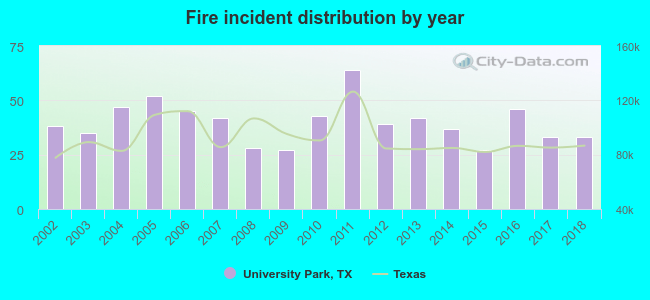 Based on the data from the years 2002 - 2018 the average number of fire incidents per year is 40. The highest number of reported fires - 64 took place in 2011, and the least - 27 in 2009. The data has a declining trend.
The average number of yearly fire incidents per 10k residents in University Park, TX compared to nearest cities:
(Note: Based on data for the last 3 years, including only cities with population 5,000 and above)
| University Park: | 15.3 |
| Highland Park: | 13.0 |
| Dallas: | 16.3 |
| Farmers Branch: | 29.3 |
| Addison: | 50.9 |
| Richardson: | 18.0 |
| Garland: | 25.0 |
| Irving: | 21.8 |
| Carrollton: | 24.4 |
 The median response time based on all reported fire incidents is 5 minutes. This is lower than the Texas median value.
The median response time in University Park, TX compared to nearest cities:
(Note: Based on data for all years, including only cities with at least 500 fire incidents)
| University Park: | 5 minutes |
| Dallas: | 4 minutes |
| Farmers Branch: | 5 minutes |
| Addison: | 5 minutes |
| Richardson: | 5 minutes |
| Garland: | 5 minutes |
| Irving: | 5 minutes |
| Carrollton: | 5 minutes |
| Mesquite: | 5 minutes |
 Based on the data from the years 2002 - 2018 the average number of fire-related yearly deaths is 0. The highest number of deaths - 1 took place in 2002, and the lowest - 0 in 2005. The data has a declining trend.
 26.4% incidents where reported in the morning and 73.6% in the evening. The most fires (16.8%) took place on Monday, and the least (11.8%) on Tuesday.
 Based on the 678 fire incident reports from years 2002 - 2018 most fires (12.4%) took place during December, and the least (4.9%) in September.
 Out of all 16,819 cases reported during the years 2002 - 2018, the most belonged to the categories: Rescue & EMS (30.9%), Hazardous Condition (26.1%), and False Alarm (24.2%).
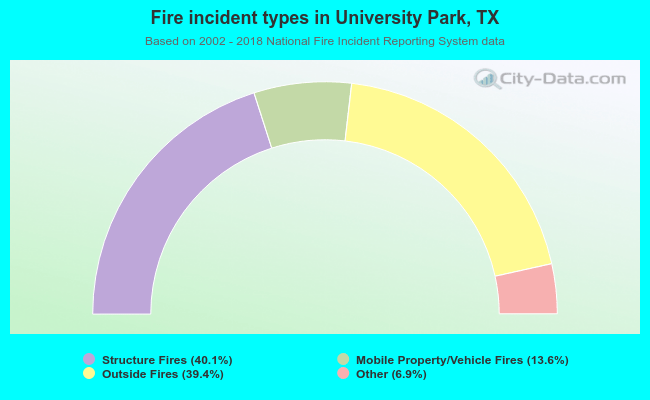 When looking into fire subcategories, the most incidents belonged to: Structure Fires (40.1%), and Outside Fires (39.4%).