Union Gap: Fire Incidents, Washington (WA)
Where are fire incidents reported in Union Gap, WA
Something went wrong! Please refresh the page.
| Fire incidents reported | |
|---|---|
| Sreet name | Count |
| MAIN ST | 148 |
| AHTANUM RD | 128 |
| 3RD AVE | 70 |
| RUDKIN RD | 62 |
| PINE ST | 60 |
| 2ND ST | 58 |
| VALLEY MALL BLVD | 58 |
| 1ST AVE | 54 |
| CORNELL AVE | 52 |
| 18TH ST | 50 |
| 5TH AVE | 48 |
| I 82 HWY | 48 |
| 3RD ST | 46 |
| WASHINGTON AVE | 44 |
| 4TH AVE | 42 |
| GOODMAN RD | 40 |
| 10TH AVE | 38 |
| BAY ST | 38 |
| 11TH AVE | 34 |
| LANDON AVE | 34 |
| 5TH ST | 32 |
| 1ST ST | 26 |
| MCCULLOUGH RD | 26 |
| 4TH ST | 22 |
| WHATCOM ST | 22 |
| 16TH AVE | 20 |
| 6TH AVE | 20 |
| CALIFORNIA ST | 16 |
| MEADOWBROOK RD | 14 |
| SUTHERLAND DR | 14 |
2002 - 2018 National Fire Incident Reporting System (NFIRS) incidents
- Incident types reported to NFIRS in Union Gap, WA
- 3,02454.4%Rescue & EMS
- 93216.8%Fire
- 4948.9%Good Intent Call
- 3897.0%Service Call
- 3636.5%Hazardous Condition
- 3356.0%False Alarm
- 100.2%Special Incident
- 70.1%Severe Weather
- 60.1%Overpressure Rupture
- Fire incident types reported to NFIRS in Union Gap, WA
- 47050.4%Structure Fires
- 25427.3%Outside Fires
- 16617.8%Mobile Property/Vehicle Fires
- 424.5%Other
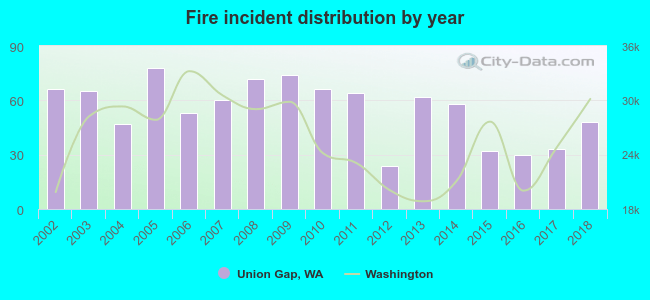 Based on the data from the years 2002 - 2018 the average number of fires per year is 55. The highest number of fire incidents - 78 took place in 2005, and the least - 24 in 2012. The data has a decreasing trend.
The average number of yearly fire incidents per 10k residents in Union Gap, WA compared to nearest cities:
(Note: Based on data for the last 3 years, including only cities with population 5,000 and above)
| Union Gap: | 61.4 |
| Yakima: | 69.6 |
| Terrace Heights: | 1.4 |
| West Valley: | 1.4 |
| Selah: | 100.3 |
| Wapato: | 264.0 |
| Toppenish: | 151.9 |
| Sunnyside: | 59.9 |
| Ellensburg: | 81.5 |
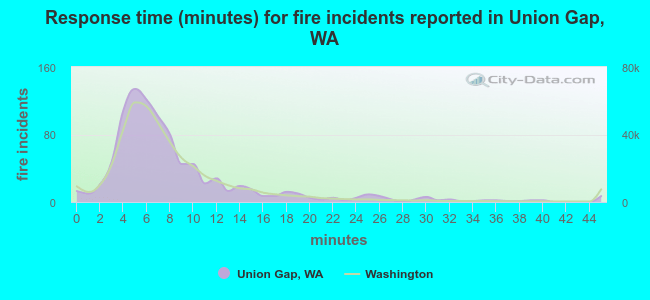 The median response time based on all reported fire incidents is 7 minutes. This is comparable to the Washington median value.
The median response time in Union Gap, WA compared to nearest cities:
(Note: Based on data for all years, including only cities with at least 500 fire incidents)
| Union Gap: | 7 minutes |
| Yakima: | 7 minutes |
| Moxee: | 10 minutes |
| Selah: | 11 minutes |
| Wapato: | 10 minutes |
| Toppenish: | 8 minutes |
| White Swan: | 14 minutes |
| Zillah: | 9 minutes |
| Naches: | 16 minutes |
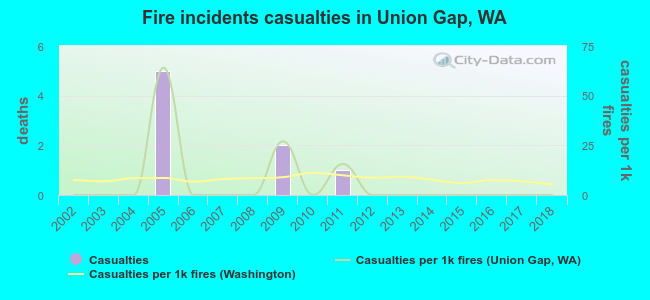 Based on the data from the years 2002 - 2018 the average number of fire-related yearly casualties is 0. The highest number of reported casualties - 5 took place in 2005, and the lowest - 0 in 2002. The data has a constant trend.
The average number of injuries per 1,000 fire incidents is 6. This indicator was the highest - 64 in 2005, and the lowest 0 in 2002. The trend for injuries per 1,000 fire incidents is constant. Compared to the Washington value the number of injuries per 1,000 fires is similar.
Based on the data from the years 2002 - 2018 the average number of fire-related yearly casualties is 0. The highest number of reported casualties - 5 took place in 2005, and the lowest - 0 in 2002. The data has a constant trend.
The average number of injuries per 1,000 fire incidents is 6. This indicator was the highest - 64 in 2005, and the lowest 0 in 2002. The trend for injuries per 1,000 fire incidents is constant. Compared to the Washington value the number of injuries per 1,000 fires is similar.
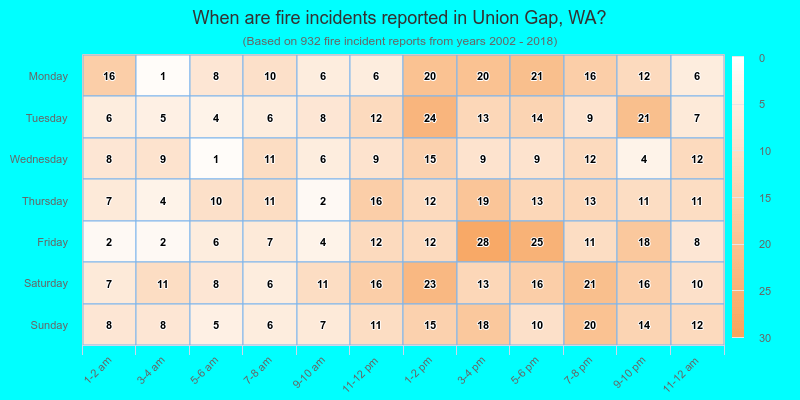
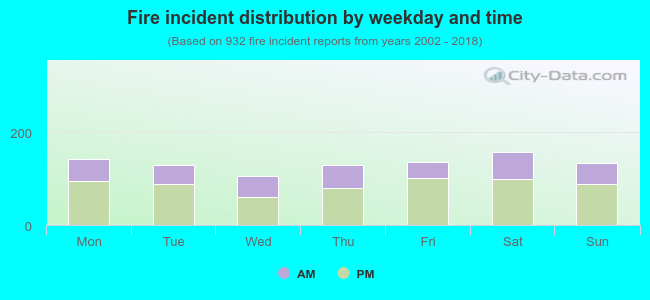 34.2% incidents where reported in the morning and 65.8% in the evening. The most fires (17.0%) took place on Saturday, and the least (11.3%) on Wednesday.
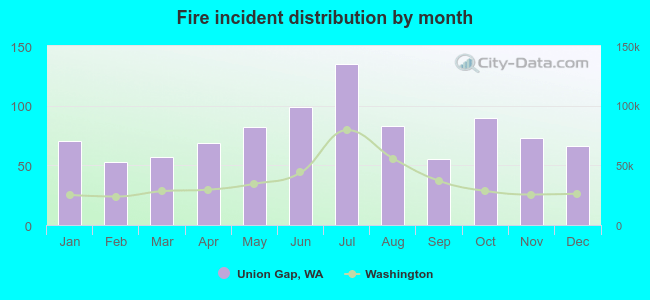 According to the 932 fire incidents from years 2002 - 2018 most fires (14.5%) took place during July, and the least (5.7%) in February.
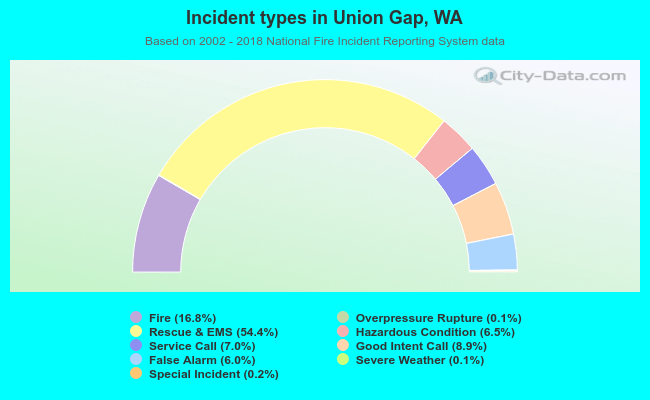 Out of all 5,560 cases reported during the years 2002 - 2018, the most belonged to the categories: Rescue & EMS (54.4%), Fire (16.8%), and Good Intent Call (8.9%).
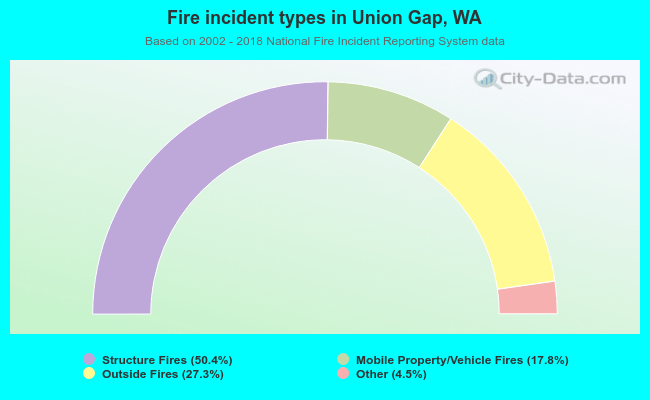 When looking into fire subcategories, the most incidents belonged to: Structure Fires (50.4%), and Outside Fires (27.3%).