Tifton: Fire Incidents, Georgia (GA)
Where are fire incidents reported in Tifton, GA
Something went wrong! Please refresh the page.
| Fire incidents reported | |
|---|---|
| Sreet name | Count |
| 82 HWY | 326 |
| INTERSTATE 75 HWY | 250 |
| 41 HWY | 190 |
| 319 HWY | 166 |
| 125 HWY | 118 |
| CENTRAL AVE | 116 |
| PARK AVE | 96 |
| TIFT AVE | 94 |
| FERRYLAKE RD | 90 |
| TIFTON ELDORADO RD | 90 |
| CHULA BROOKFIELD RD | 88 |
| OLD OMEGA RD | 88 |
| VIRGINIA AVE | 84 |
| GOLDEN RD | 78 |
| UNION RD | 78 |
| 2ND ST | 76 |
| COLLEGE AVE | 70 |
| CARPENTER RD | 58 |
| 8TH ST | 56 |
| 7TH ST | 54 |
| SOUTHWELL BLVD | 48 |
| WHIDDON MILL RD | 48 |
| MAIN ST | 46 |
| TIFTON-ELDORADO RD | 46 |
| ALDER ST | 44 |
| LOWER BROOKFIELD RD | 44 |
| PRINCE AVE | 44 |
| UPPER TY TY RD | 44 |
| PARKWAY DR | 42 |
| ZION HOPE RD | 42 |
| Other | 1,095 |
2004 - 2018 National Fire Incident Reporting System (NFIRS) incidents
- Incident types reported to NFIRS in Tifton, GA
- 3,80934.0%Fire
- 3,35730.0%Hazardous Condition
- 1,70115.2%Rescue & EMS
- 1,15810.3%Good Intent Call
- 7456.6%False Alarm
- 4023.6%Service Call
- 170.2%Overpressure Rupture
- Fire incident types reported to NFIRS in Tifton, GA
- 1,97551.9%Outside Fires
- 1,12629.6%Structure Fires
- 69618.3%Mobile Property/Vehicle Fires
- 120.3%Other
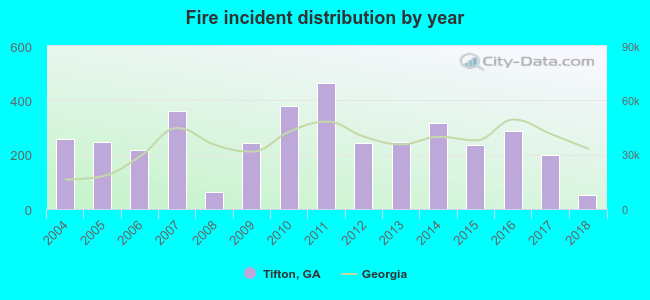 According to the data from the years 2004 - 2018 the average number of fires per year is 254. The highest number of reported fires - 464 took place in 2011, and the least - 52 in 2018. The data has a decreasing trend.
The average number of yearly fire incidents per 10k residents in Tifton, GA compared to nearest cities:
(Note: Based on data for the last 3 years, including only cities with population 5,000 and above)
| Tifton: | 107.4 |
| Sylvester: | 249.8 |
| Fitzgerald: | 108.1 |
| Adel: | 165.4 |
| Moultrie: | 179.5 |
| Cordele: | 179.8 |
| Douglas: | 164.0 |
| Albany: | 75.1 |
| Camilla: | 135.1 |
 The median response time based on all reported fire incidents is 6 minutes. This is similar to the Georgia median value.
The median response time in Tifton, GA compared to nearest cities:
(Note: Based on data for all years, including only cities with at least 500 fire incidents)
| Tifton: | 6 minutes |
| Norman Park: | 8 minutes |
| Ashburn: | 4 minutes |
| Sylvester: | 8 minutes |
| Fitzgerald: | 4 minutes |
| Adel: | 7 minutes |
| Nashville: | 6 minutes |
| Moultrie: | 5 minutes |
| Hahira: | 7 minutes |
 Based on the data from the years 2004 - 2018 the average number of fire-related yearly deaths is 1. The highest number of reported deaths - 5 took place in 2015, and the lowest - 0 in 2004. The data has a constant trend.
The average number of fatalities per 1,000 fires is 6. This indicator was the highest - 32 in 2008, and the lowest 0 in 2004. The trend for deaths per 1,000 incidents is constant. Compared to the state value the number of fatalities per 1,000 fire incidents is much higher.
Based on the data from the years 2004 - 2018 the average number of fire-related yearly deaths is 1. The highest number of reported deaths - 5 took place in 2015, and the lowest - 0 in 2004. The data has a constant trend.
The average number of fatalities per 1,000 fires is 6. This indicator was the highest - 32 in 2008, and the lowest 0 in 2004. The trend for deaths per 1,000 incidents is constant. Compared to the state value the number of fatalities per 1,000 fire incidents is much higher.
 According to the data from the years 2004 - 2018 the average number of fire-related yearly casualties is 2. The highest number of casualties - 6 took place in 2013, and the lowest - 0 in 2008. The data has a declining trend.
The average number of casualties per 1,000 fire incidents is 6. This indicator was the highest - 24 in 2013, and the lowest 0 in 2008. The trend for casualties per 1,000 incidents is dropping. Compared to the Georgia value the number of casualties per 1,000 fires is lower.
According to the data from the years 2004 - 2018 the average number of fire-related yearly casualties is 2. The highest number of casualties - 6 took place in 2013, and the lowest - 0 in 2008. The data has a declining trend.
The average number of casualties per 1,000 fire incidents is 6. This indicator was the highest - 24 in 2013, and the lowest 0 in 2008. The trend for casualties per 1,000 incidents is dropping. Compared to the Georgia value the number of casualties per 1,000 fires is lower.Casualties per 1,000 incidents in Tifton, GA compared to nearest cities:
(Note: Based on data for all years, including only cities with at least 500 fire incidents)
| Tifton: | 6.6 |
| Norman Park: | 25.3 |
| Ashburn: | 2.8 |
| Sylvester: | 1.2 |
| Fitzgerald: | 0.9 |
| Adel: | 4.4 |
| Nashville: | 13.3 |
| Moultrie: | 16.9 |
| Hahira: | 1.8 |
 27.5% incidents where reported in the morning and 72.5% in the evening. The most fires (15.3%) took place on Saturday, and the least (12.8%) on Thursday.
 Based on the 3,809 fire incidents from years 2004 - 2018 most fires (11.5%) took place during May, and the least (5.6%) in August.
 Out of all 11,204 cases reported during the years 2004 - 2018, the most belonged to the categories: Fire (34.0%), Hazardous Condition (30.0%), and Rescue & EMS (15.2%).
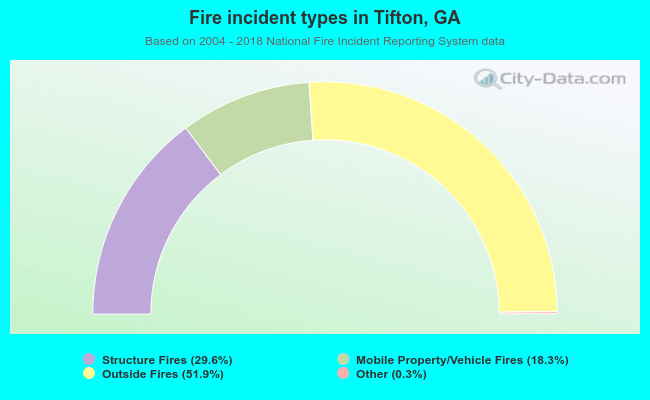 When looking into fire subcategories, the most reports belonged to: Outside Fires (51.9%), and Structure Fires (29.6%).