Sturtevant: Fire Incidents, Wisconsin (WI)
Where are fire incidents reported in Sturtevant, WI
Something went wrong! Please refresh the page.
|
| |||||||||||||||||||||||||||||||||||||||||||||||||||||||||||||||||||||||||||||||||||||||||||||||||||||||||||||
2002 - 2018 National Fire Incident Reporting System (NFIRS) incidents
- Incident types reported to NFIRS in Sturtevant, WI
- 2,55664.5%Rescue & EMS
- 42010.6%False Alarm
- 3538.9%Fire
- 2366.0%Service Call
- 2285.8%Hazardous Condition
- 1574.0%Good Intent Call
- 60.2%Overpressure Rupture
- 60.2%Special Incident
- Fire incident types reported to NFIRS in Sturtevant, WI
- 13939.4%Structure Fires
- 10128.6%Outside Fires
- 6518.4%Mobile Property/Vehicle Fires
- 4813.6%Other
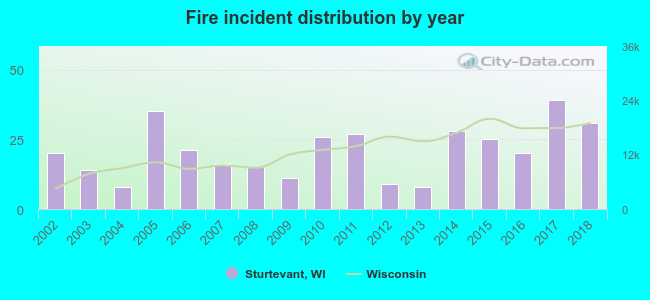 According to the data from the years 2002 - 2018 the average number of fire incidents per year is 21. The highest number of fire incidents - 39 took place in 2017, and the least - 8 in 2004. The data has a rising trend.
The average number of yearly fire incidents per 10k residents in Sturtevant, WI compared to nearest cities:
(Note: Based on data for the last 3 years, including only cities with population 5,000 and above)
| Sturtevant: | 43.0 |
| Mount Pleasant: | 8.9 |
| Racine: | 33.7 |
| Somers: | 39.9 |
| Caledonia: | 8.1 |
| Kenosha: | 23.0 |
| Pleasant Prairie: | 20.6 |
| Oak Creek: | 30.0 |
| South Milwaukee: | 23.5 |

 Based on the reports from the years 2002 - 2018 the average number of fire-related casualties per year is 0. The highest number of injuries - 1 took place in 2002, and the lowest - 0 in 2003. The data has a dropping trend.
 36.8% incidents where reported in the morning and 63.2% in the evening. The most fires (16.4%) took place on Saturday, and the least (12.2%) on Thursday.
 According to the 353 fire incidents from years 2002 - 2018 most fires (12.5%) took place during March, and the least (5.1%) in December.
 Out of all 3,962 cases reported during the years 2002 - 2018, the most belonged to the categories: Rescue & EMS (64.5%), False Alarm (10.6%), and Fire (8.9%).
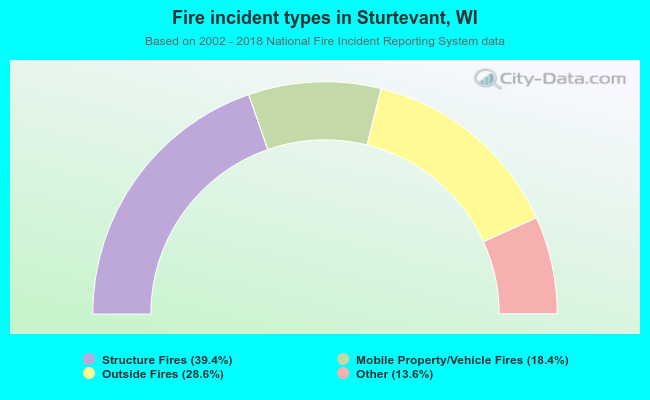 When looking into fire subcategories, the most reports belonged to: Structure Fires (39.4%), and Outside Fires (28.6%).