St. Cloud: Fire Incidents, Florida (FL)
Where are fire incidents reported in St. Cloud, FL
Something went wrong! Please refresh the page.
| Fire incidents reported | |
|---|---|
| Sreet name | Count |
| 13TH ST | 200 |
| KISSIMMEE PARK RD | 70 |
| CANOE CREEK RD | 66 |
| MICHIGAN AVE | 66 |
| 10TH ST | 48 |
| HICKORY TREE RD | 42 |
| IRLO BRONSON HWY | 40 |
| LAKESHORE BLVD | 36 |
| NEW YORK AVE | 32 |
| KENTUCKY AVE | 30 |
| OHIO AVE | 30 |
| ORANGE AVE | 30 |
| MASSACHUSETTS AVE | 28 |
| NARCOOSSEE RD | 26 |
| TENNESSEE AVE | 26 |
| LOUISIANA AVE | 24 |
| MINNESOTA AVE | 24 |
| NEW NOLTE RD | 24 |
| PACKARD AVE | 24 |
| RAMBLER AVE | 24 |
| 5TH ST | 22 |
| MONTANA AVE | 22 |
| NOVA RD | 22 |
| 17TH ST | 20 |
| DELAWARE AVE | 20 |
| FLORIDA AVE | 20 |
| INDIANA AVE | 20 |
| JERSEY AVE | 20 |
| KAISER AVE | 20 |
| OLD CANOE CREEK RD | 20 |
| Other | 433 |
2002 - 2011 National Fire Incident Reporting System (NFIRS) incidents
- Incident types reported to NFIRS in St. Cloud, FL
- 5,25356.7%Rescue & EMS
- 1,52916.5%Fire
- 1,00910.9%Hazardous Condition
- 5966.4%Service Call
- 5155.6%Good Intent Call
- 3213.5%False Alarm
- 250.3%Special Incident
- 110.1%Overpressure Rupture
- Fire incident types reported to NFIRS in St. Cloud, FL
- 81653.4%Outside Fires
- 43128.2%Structure Fires
- 24015.7%Mobile Property/Vehicle Fires
- 422.7%Other
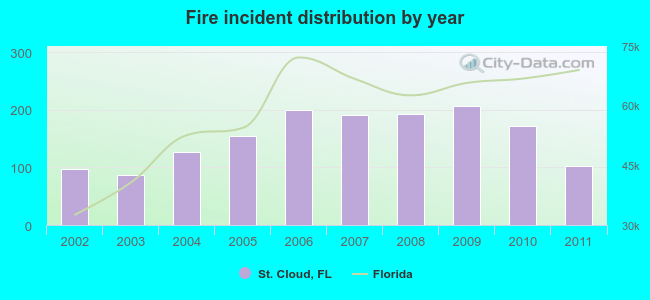 Based on the data from the years 2002 - 2011 the average number of fires per year is 153. The highest number of reported fire incidents - 207 took place in 2009, and the least - 86 in 2003. The data has a growing trend.
 The median response time based on all reported fire incidents is 6 minutes. This is close to the state median value.
The median response time in St. Cloud, FL compared to nearest cities:
(Note: Based on data for all years, including only cities with at least 500 fire incidents)
| St. Cloud: | 6 minutes |
| Kissimmee: | 8 minutes |
| Poinciana: | 10 minutes |
| Davenport: | 9 minutes |
| Orlando: | 7 minutes |
| Haines City: | 8 minutes |
| Winter Park: | 6 minutes |
| Maitland: | 5 minutes |
| Ocoee: | 6 minutes |
 According to the data from the years 2002 - 2011 the average number of fire-related yearly casualties is 2. The highest number of injuries - 7 took place in 2011, and the lowest - 0 in 2002. The data has a rising trend.
The average number of casualties per 1,000 fire incidents is 19. This indicator was the highest - 68 in 2011, and the lowest 0 in 2002. The trend for casualties per 1,000 incidents is growing. Compared to the state value the number of injuries per 1,000 fires is higher.
According to the data from the years 2002 - 2011 the average number of fire-related yearly casualties is 2. The highest number of injuries - 7 took place in 2011, and the lowest - 0 in 2002. The data has a rising trend.
The average number of casualties per 1,000 fire incidents is 19. This indicator was the highest - 68 in 2011, and the lowest 0 in 2002. The trend for casualties per 1,000 incidents is growing. Compared to the state value the number of injuries per 1,000 fires is higher.Casualties per 1,000 incidents in St. Cloud, FL compared to nearest cities:
(Note: Based on data for all years, including only cities with at least 500 fire incidents)
| St. Cloud: | 15.0 |
| Kissimmee: | 13.7 |
| Poinciana: | 15.3 |
| Davenport: | 4.7 |
| Orlando: | 19.3 |
| Haines City: | 5.3 |
| Winter Park: | 24.3 |
| Maitland: | 14.0 |
| Ocoee: | 2.6 |
 24.5% incidents where reported in the morning and 75.5% in the evening. The most fires (18.2%) took place on Saturday, and the least (12.2%) on Friday.
 Based on the 1,529 fires from years 2002 - 2011 most fires (10.9%) took place during March, and the least (5.8%) in December.
 Out of all 9,264 cases reported during the years 2002 - 2011, the most belonged to the categories: Rescue & EMS (56.7%), Fire (16.5%), and Hazardous Condition (10.9%).
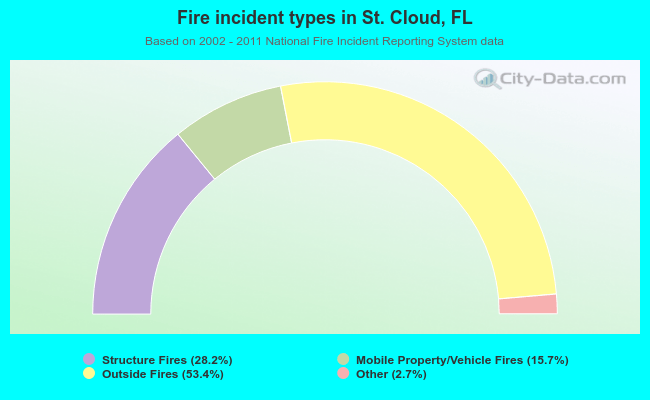 When looking into fire subcategories, the most reports belonged to: Outside Fires (53.4%), and Structure Fires (28.2%).