Springfield: Fire Incidents, Pennsylvania (PA)
Where are fire incidents reported in Springfield, PA
Something went wrong! Please refresh the page.
|
| |||||||||||||||||||||||||||||||||||||||||||||||||||||||||||||||||||||||||||||||||||||||||||||||||||||||||||||
2004 - 2018 National Fire Incident Reporting System (NFIRS) incidents
- Incident types reported to NFIRS in Springfield, PA
- 41442.2%Fire
- 15916.2%Hazardous Condition
- 14715.0%Good Intent Call
- 949.6%Rescue & EMS
- 818.3%False Alarm
- 484.9%Service Call
- 363.7%Special Incident
- 10.1%Overpressure Rupture
- Fire incident types reported to NFIRS in Springfield, PA
- 31576.1%Structure Fires
- 5513.3%Outside Fires
- 327.7%Other
- 122.9%Mobile Property/Vehicle Fires
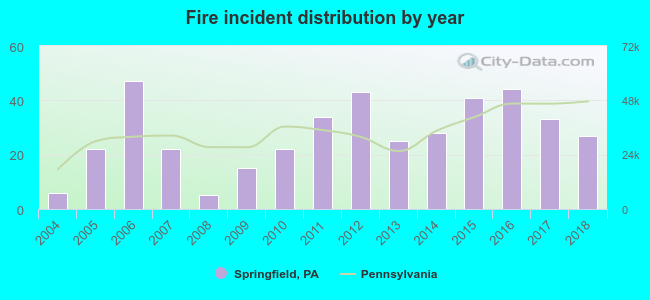 According to the data from the years 2004 - 2018 the average number of fire incidents per year is 28. The highest number of fires - 47 took place in 2006, and the least - 5 in 2008. The data has an increasing trend.
The average number of yearly fire incidents per 10k residents in Springfield, PA compared to nearest cities:
(Note: Based on data for the last 3 years, including only cities with population 5,000 and above)
| Springfield: | 14.6 |
| Swarthmore: | 52.1 |
| Clifton Heights: | 46.0 |
| Drexel Hill: | 16.8 |
| Folsom: | 28.4 |
| Darby Township: | 6.2 |
| Media: | 151.6 |
| Glenolden: | 98.5 |
| Collingdale: | 61.4 |
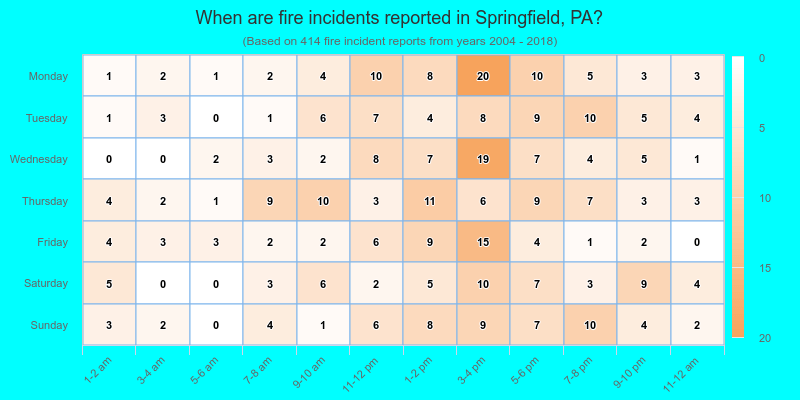
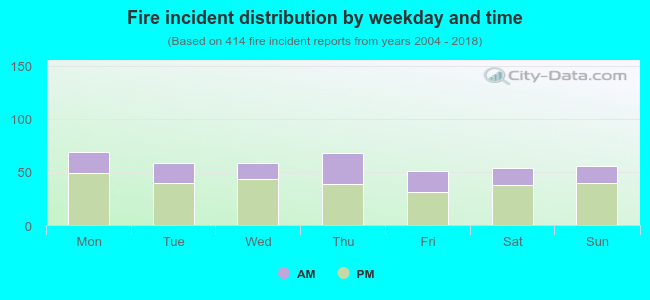 32.4% incidents where reported in the morning and 67.6% in the evening. The most fires (16.7%) took place on Monday, and the least (12.3%) on Friday.
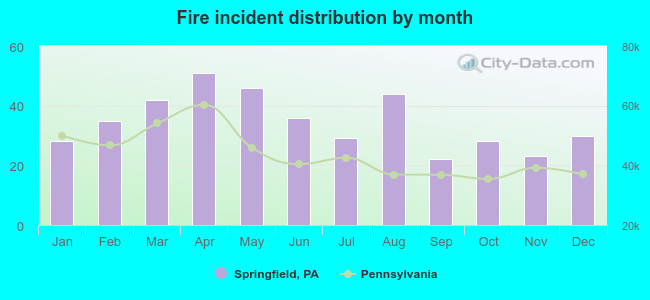 Based on the 414 reports from years 2004 - 2018 most fires (12.3%) took place during April, and the least (5.3%) in September.
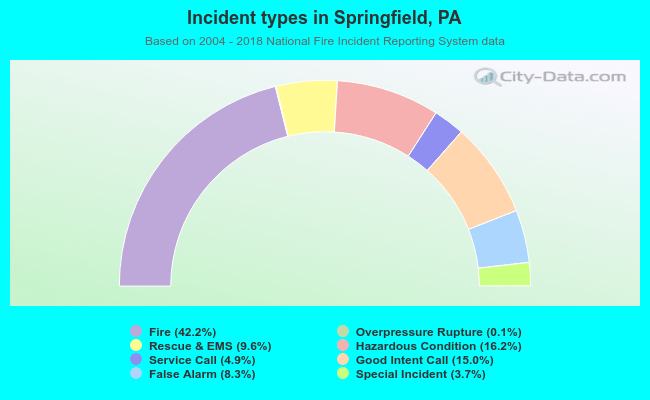 Out of all 980 cases reported during the years 2004 - 2018, the most belonged to the categories: Fire (42.2%), Hazardous Condition (16.2%), and Good Intent Call (15.0%).
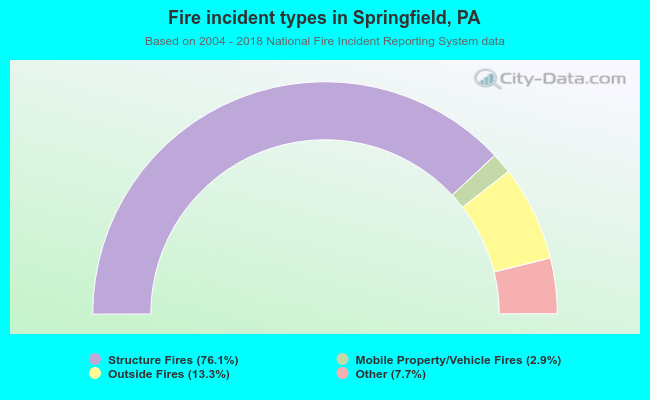 When looking into fire subcategories, the most incidents belonged to: Structure Fires (76.1%), and Outside Fires (13.3%).