Spring Lake Park: Fire Incidents, Minnesota (MN)
Where are fire incidents reported in Spring Lake Park, MN
Something went wrong! Please refresh the page.
|
| |||||||||||||||||||||||||||||||||||||||||||||||||||||||||||||||||||||||||||||||||||||||||||||||||||||||||||||
2002 - 2018 National Fire Incident Reporting System (NFIRS) incidents
- Incident types reported to NFIRS in Spring Lake Park, MN
- 33628.4%Hazardous Condition
- 30125.5%Fire
- 19916.8%Rescue & EMS
- 13511.4%Good Intent Call
- 12210.3%False Alarm
- 726.1%Service Call
- 80.7%Severe Weather
- 50.4%Special Incident
- 40.3%Overpressure Rupture
- Fire incident types reported to NFIRS in Spring Lake Park, MN
- 14748.8%Structure Fires
- 8929.6%Outside Fires
- 5919.6%Mobile Property/Vehicle Fires
- 62.0%Other
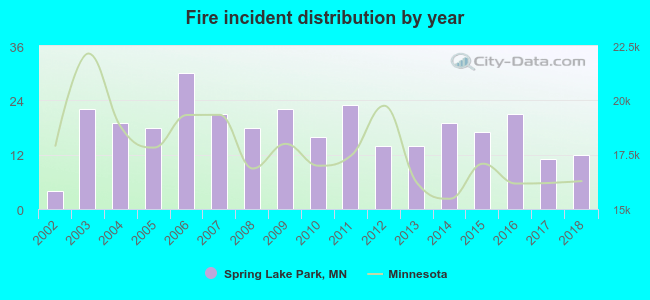 According to the data from the years 2002 - 2018 the average number of fire incidents per year is 18. The highest number of reported fires - 30 took place in 2006, and the least - 4 in 2002. The data has an increasing trend.
The average number of yearly fire incidents per 10k residents in Spring Lake Park, MN compared to nearest cities:
(Note: Based on data for the last 3 years, including only cities with population 5,000 and above)
| Spring Lake Park: | 22.7 |
| Mounds View: | 19.2 |
| Fridley: | 45.8 |
| Blaine: | 16.9 |
| New Brighton: | 30.8 |
| Brooklyn Center: | 38.6 |
| Columbia Heights: | 33.0 |
| Coon Rapids: | 20.4 |
| Brooklyn Park: | 30.2 |

 Based on the reports from the years 2002 - 2018 the average number of fire-related casualties per year is 0. The highest number of reported injuries - 2 took place in 2010, and the lowest - 0 in 2002. The data has a constant trend.
 29.2% incidents where reported in the morning and 70.8% in the evening. The most fires (18.9%) took place on Sunday, and the least (10.6%) on Wednesday.
 According to the 301 fire incident reports from years 2002 - 2018 most fires (15.3%) took place during June, and the least (3.7%) in September.
 Out of all 1,182 cases reported during the years 2002 - 2018, the most belonged to the categories: Hazardous Condition (28.4%), Fire (25.5%), and Rescue & EMS (16.8%).
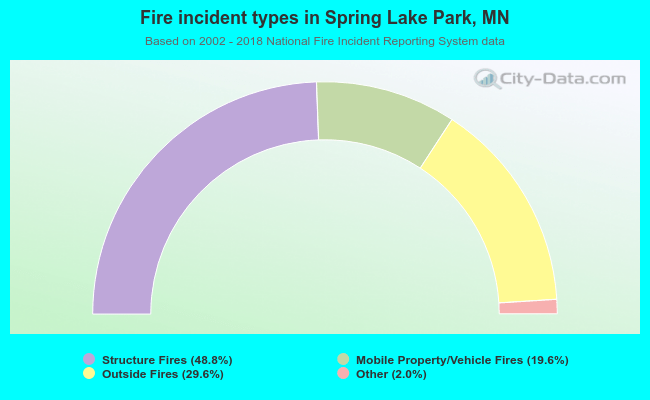 When looking into fire subcategories, the most incidents belonged to: Structure Fires (48.8%), and Outside Fires (29.6%).