Somersworth: Fire Incidents, New Hampshire (NH)
Where are fire incidents reported in Somersworth, NH
Something went wrong! Please refresh the page.
|
| |||||||||||||||||||||||||||||||||||||||||||||||||||||||||||||||||||||||||||||||||||||||||||||||||||||||||||||
2003 - 2018 National Fire Incident Reporting System (NFIRS) incidents
- Incident types reported to NFIRS in Somersworth, NH
- 2,41337.4%Rescue & EMS
- 1,39321.6%Hazardous Condition
- 84813.1%Service Call
- 65810.2%Good Intent Call
- 5989.3%False Alarm
- 5117.9%Fire
- 200.3%Severe Weather
- 110.2%Special Incident
- Fire incident types reported to NFIRS in Somersworth, NH
- 22043.1%Structure Fires
- 21441.9%Outside Fires
- 5210.2%Mobile Property/Vehicle Fires
- 254.9%Other
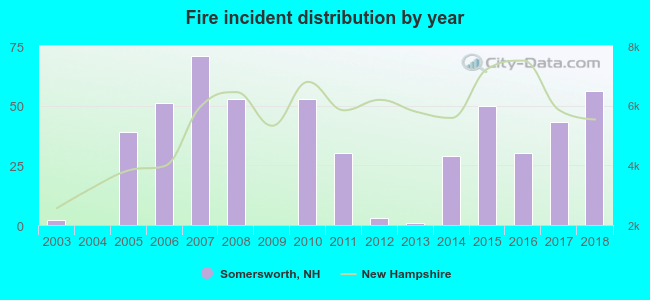 According to the data from the years 2003 - 2018 the average number of fires per year is 32. The highest number of reported fire incidents - 71 took place in 2007, and the least - 0 in 2004. The data has an increasing trend.
The average number of yearly fire incidents per 10k residents in Somersworth, NH compared to nearest cities:
(Note: Based on data for the last 3 years, including only cities with population 5,000 and above)
| Somersworth: | 36.5 |
| Dover: | 27.6 |
| Rochester: | 24.6 |
| Durham: | 42.2 |
| Barrington: | 30.3 |
| Newmarket: | 32.1 |
| Portsmouth: | 34.1 |
| Stratham: | 53.3 |
| Rye: | 37.8 |
 The median response time based on all reported fire incidents is 4 minutes. This is lower compared to the state median value.
The median response time in Somersworth, NH compared to nearest cities:
(Note: Based on data for all years, including only cities with at least 500 fire incidents)
| Somersworth: | 4 minutes |
| Dover: | 5 minutes |
| Rochester: | 5 minutes |
| Durham: | 4 minutes |
| Farmington: | 7 minutes |
| Sanford: | 4 minutes |
| Portsmouth: | 6 minutes |
| Wells: | 7 minutes |
| Epping: | 9 minutes |
 32.1% incidents where reported in the morning and 67.9% in the evening. The most fires (16.8%) took place on Tuesday, and the least (11.5%) on Sunday.
 Based on the 511 fire incident reports from years 2003 - 2018 most fires (14.3%) took place during May, and the least (4.3%) in December.
 Out of all 6,457 cases reported during the years 2003 - 2018, the most belonged to the categories: Rescue & EMS (37.4%), Hazardous Condition (21.6%), and Service Call (13.1%).
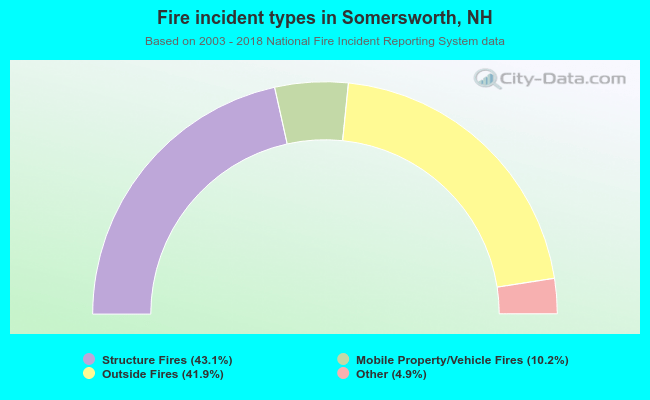 When looking into fire subcategories, the most reports belonged to: Structure Fires (43.1%), and Outside Fires (41.9%).