Socorro: Fire Incidents, New Mexico (NM)
Where are fire incidents reported in Socorro, NM
Something went wrong! Please refresh the page.
|
| |||||||||||||||||||||||||||||||||||||||||||||||||||||||||||||||||||||||||||||||||||||||||||||||||||||||||||||
| Other | 225 | |||||||||||||||||||||||||||||||||||||||||||||||||||||||||||||||||||||||||||||||||||||||||||||||||||||||||||||
2002 - 2018 National Fire Incident Reporting System (NFIRS) incidents
- Incident types reported to NFIRS in Socorro, NM
- 80951.2%Fire
- 34221.6%Service Call
- 20312.8%False Alarm
- 1076.8%Hazardous Condition
- 1016.4%Good Intent Call
- 100.6%Rescue & EMS
- 60.4%Special Incident
- 20.1%Overpressure Rupture
- Fire incident types reported to NFIRS in Socorro, NM
- 36244.7%Outside Fires
- 24830.7%Structure Fires
- 10412.9%Mobile Property/Vehicle Fires
- 9511.7%Other
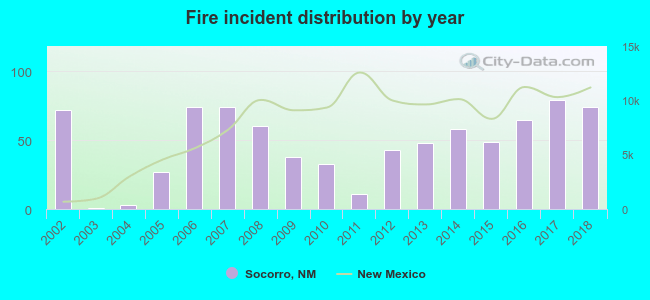 According to the data from the years 2002 - 2018 the average number of fires per year is 48. The highest number of reported fires - 79 took place in 2017, and the least - 1 in 2003. The data has a rising trend.
The average number of yearly fire incidents per 10k residents in Socorro, NM compared to nearest cities:
(Note: Based on data for the last 3 years, including only cities with population 5,000 and above)
| Socorro: | 83.0 |
| Belen: | 195.1 |
| Los Chaves: | 28.8 |
| Los Lunas: | 192.2 |
| South Valley: | 2.0 |
| Albuquerque: | 25.7 |
 The median response time based on all reported fire incidents is 4 minutes. This is much lower compared to the state median value.
The median response time in Socorro, NM compared to nearest cities:
(Note: Based on data for all years, including only cities with at least 500 fire incidents)
| Socorro: | 4 minutes |
| Jarales: | 11 minutes |
| Belen: | 10 minutes |
| Los Lunas: | 10 minutes |
| Albuquerque: | 7 minutes |
| Tijeras: | 11 minutes |
 31.1% incidents where reported in the morning and 68.9% in the evening. The most fires (15.8%) took place on Wednesday, and the least (12.6%) on Sunday.
 Based on the 809 incident reports from years 2002 - 2018 most fires (13.6%) took place during June, and the least (3.8%) in August.
 Out of all 1,580 cases reported during the years 2002 - 2018, the most belonged to the categories: Fire (51.2%), Service Call (21.6%), and False Alarm (12.8%).
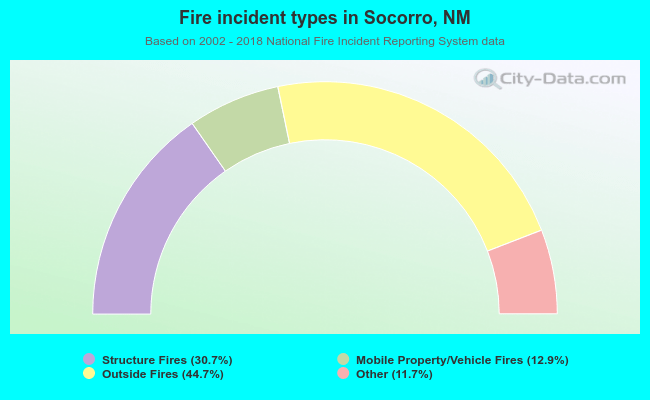 When looking into fire subcategories, the most reports belonged to: Outside Fires (44.7%), and Structure Fires (30.7%).