Silvis: Fire Incidents, Illinois (IL)
Where are fire incidents reported in Silvis, IL
Something went wrong! Please refresh the page.
|
| |||||||||||||||||||||||||||||||||||||||||||||||||||||||||||||||||||||||||||||||||||||||||||||||||||||||||||||
2003 - 2018 National Fire Incident Reporting System (NFIRS) incidents
- Incident types reported to NFIRS in Silvis, IL
- 44431.9%Fire
- 24517.6%False Alarm
- 23717.0%Hazardous Condition
- 18213.1%Service Call
- 17812.8%Good Intent Call
- 997.1%Rescue & EMS
- 80.6%Overpressure Rupture
- Fire incident types reported to NFIRS in Silvis, IL
- 22049.5%Structure Fires
- 13029.3%Outside Fires
- 7817.6%Mobile Property/Vehicle Fires
- 163.6%Other
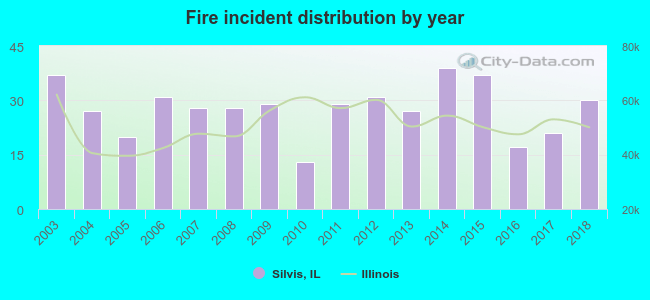 Based on the data from the years 2003 - 2018 the average number of fire incidents per year is 28. The highest number of fires - 39 took place in 2014, and the least - 13 in 2010. The data has a decreasing trend.
The average number of yearly fire incidents per 10k residents in Silvis, IL compared to nearest cities:
(Note: Based on data for the last 3 years, including only cities with population 5,000 and above)
| Silvis: | 30.1 |
| East Moline: | 45.0 |
| Colona: | 119.0 |
| Moline: | 25.3 |
| Rock Island: | 24.4 |
| Milan: | 66.6 |
| Geneseo: | 44.9 |
| Kewanee: | 50.0 |
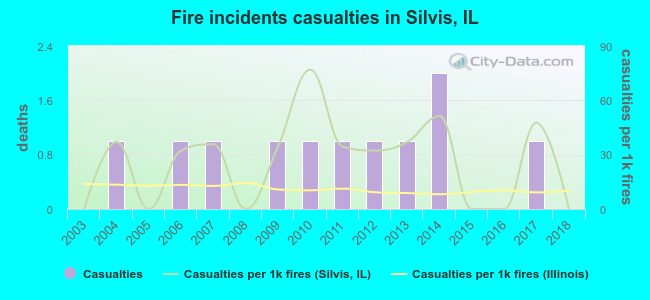 According to the reports from the years 2003 - 2018 the average number of fire-related yearly casualties is 1. The highest number of reported injuries - 2 took place in 2014, and the lowest - 0 in 2003. The data has a constant trend.
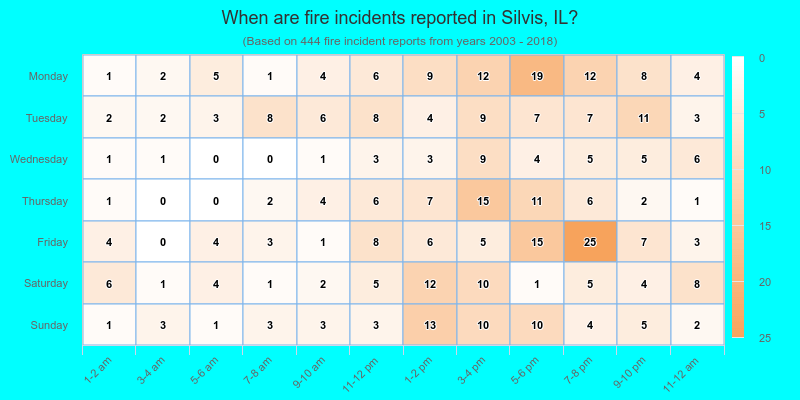
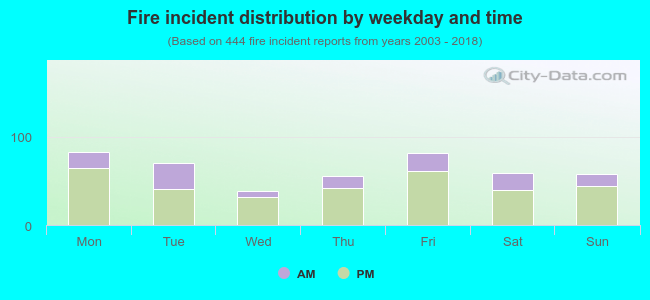 27.0% incidents where reported in the morning and 73.0% in the evening. The most fires (18.7%) took place on Monday, and the least (8.6%) on Wednesday.
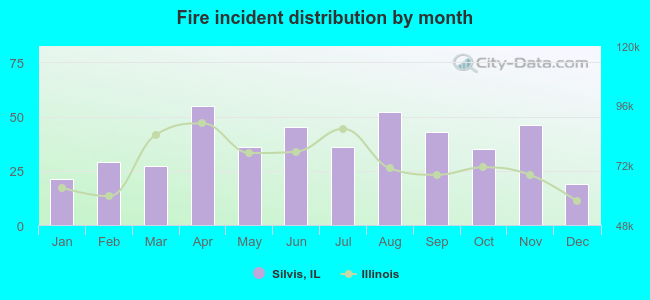 According to the 444 incident reports from years 2003 - 2018 most fires (12.4%) took place during April, and the least (4.3%) in December.
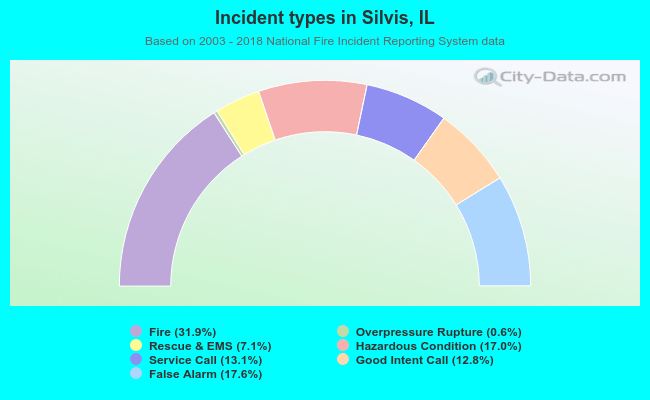 Out of all 1,393 cases reported during the years 2003 - 2018, the most belonged to the categories: Fire (31.9%), False Alarm (17.6%), and Hazardous Condition (17.0%).
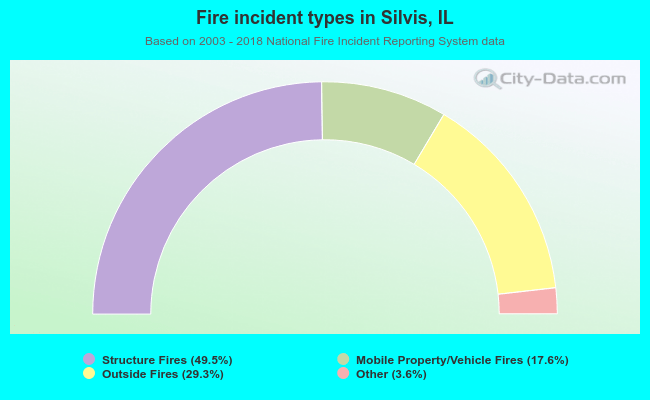 When looking into fire subcategories, the most incidents belonged to: Structure Fires (49.5%), and Outside Fires (29.3%).