Seminole: Fire Incidents, Oklahoma (OK)
Where are fire incidents reported in Seminole, OK
Something went wrong! Please refresh the page.
|
| |||||||||||||||||||||||||||||||||||||||||||||||||||||||||||||||||||||||||||||||||||||||||||||||||||||||||||||
| Other | 662 | |||||||||||||||||||||||||||||||||||||||||||||||||||||||||||||||||||||||||||||||||||||||||||||||||||||||||||||
2002 - 2018 National Fire Incident Reporting System (NFIRS) incidents
- Incident types reported to NFIRS in Seminole, OK
- 2,06240.9%Fire
- 95218.9%Rescue & EMS
- 69613.8%Hazardous Condition
- 65012.9%Good Intent Call
- 3406.8%Service Call
- 3206.4%False Alarm
- 110.2%Overpressure Rupture
- Fire incident types reported to NFIRS in Seminole, OK
- 1,40968.3%Outside Fires
- 38618.7%Structure Fires
- 22410.9%Mobile Property/Vehicle Fires
- 432.1%Other
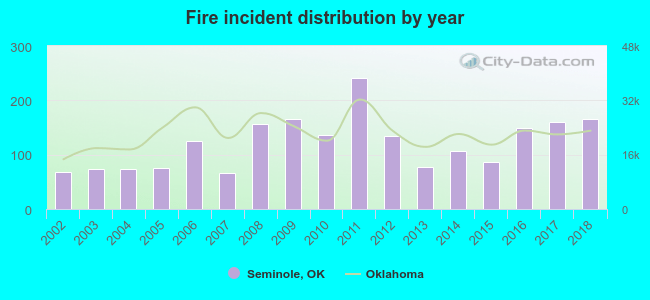 According to the data from the years 2002 - 2018 the average number of fires per year is 121. The highest number of fires - 242 took place in 2011, and the least - 67 in 2007. The data has a growing trend.
The average number of yearly fire incidents per 10k residents in Seminole, OK compared to nearest cities:
(Note: Based on data for the last 3 years, including only cities with population 5,000 and above)
| Seminole: | 211.1 |
| Tecumseh: | 161.9 |
| Shawnee: | 84.4 |
| Holdenville: | 92.3 |
| Ada: | 90.5 |
| Harrah: | 147.3 |
| Choctaw: | 100.3 |
| Henryetta: | 155.7 |
| Noble: | 111.9 |
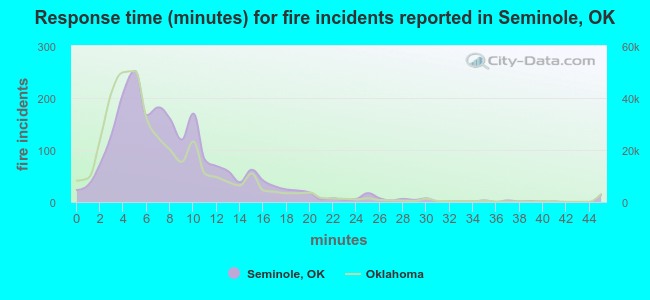 The median response time based on all reported fire incidents is 7 minutes. This is close to the Oklahoma median value.
The median response time in Seminole, OK compared to nearest cities:
(Note: Based on data for all years, including only cities with at least 500 fire incidents)
| Seminole: | 7 minutes |
| Wewoka: | 7 minutes |
| Tecumseh: | 7 minutes |
| Shawnee: | 6 minutes |
| Holdenville: | 5 minutes |
| Konawa: | 8 minutes |
| Meeker: | 10 minutes |
| McLoud: | 12 minutes |
| Ada: | 6 minutes |
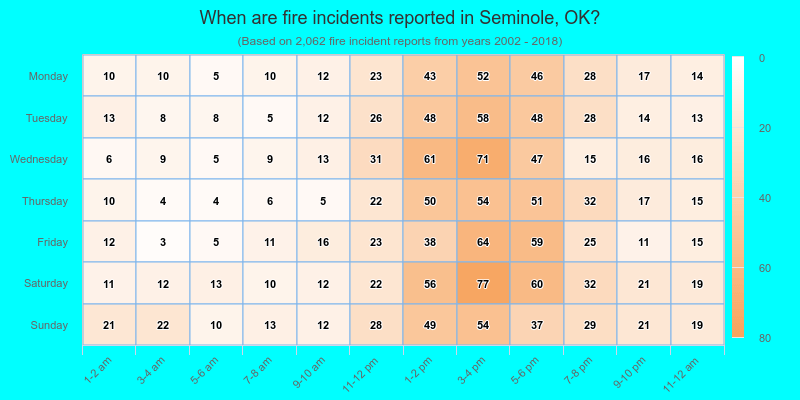
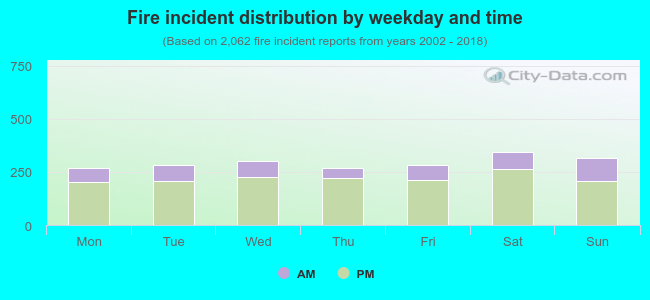 25.3% incidents where reported in the morning and 74.7% in the evening. The most fires (16.7%) took place on Saturday, and the least (13.1%) on Monday.
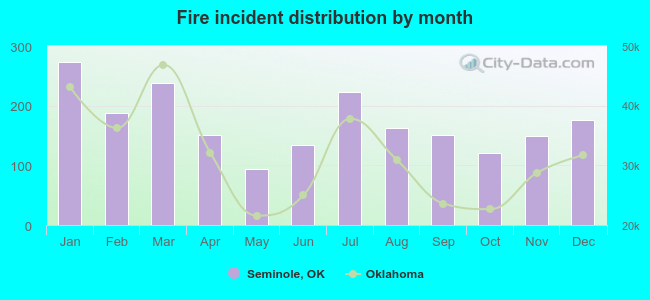 Based on the 2,062 reports from years 2002 - 2018 most fires (13.2%) took place during January, and the least (4.6%) in May.
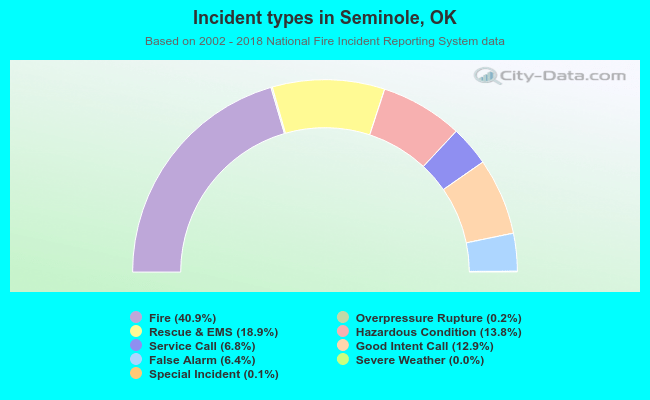 Out of all 5,036 cases reported during the years 2002 - 2018, the most belonged to the categories: Fire (40.9%), Rescue & EMS (18.9%), and Hazardous Condition (13.8%).
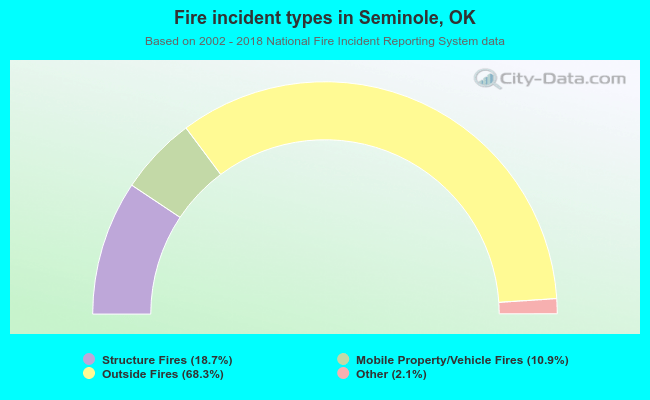 When looking into fire subcategories, the most reports belonged to: Outside Fires (68.3%), and Structure Fires (18.7%).