Roma: Fire Incidents, Texas (TX)
Where are fire incidents reported in Roma, TX
Something went wrong! Please refresh the page.
|
| |||||||||||||||||||||||||||||||||||||||||||||||||||||||||||||||||||||||||||||||||||||||||||||||||||||||||||||
| Other | 198 | |||||||||||||||||||||||||||||||||||||||||||||||||||||||||||||||||||||||||||||||||||||||||||||||||||||||||||||
2003 - 2018 National Fire Incident Reporting System (NFIRS) incidents
- Incident types reported to NFIRS in Roma, TX
- 2,01653.8%Fire
- 84522.5%Rescue & EMS
- 42011.2%Service Call
- 2767.4%Hazardous Condition
- 1243.3%Good Intent Call
- 541.4%False Alarm
- 70.2%Severe Weather
- 40.1%Overpressure Rupture
- Fire incident types reported to NFIRS in Roma, TX
- 1,45372.1%Outside Fires
- 33316.5%Structure Fires
- 1708.4%Mobile Property/Vehicle Fires
- 603.0%Other
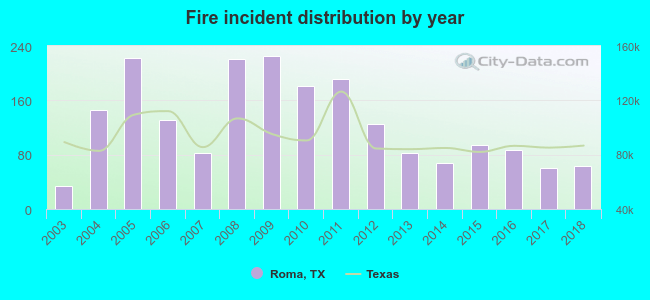 According to the data from the years 2003 - 2018 the average number of fire incidents per year is 126. The highest number of fires - 226 took place in 2009, and the least - 34 in 2003. The data has an increasing trend.
The average number of yearly fire incidents per 10k residents in Roma, TX compared to nearest cities:
(Note: Based on data for the last 3 years, including only cities with population 5,000 and above)
| Roma: | 69.7 |
| Rio Grande City: | 175.5 |
 The median response time based on all reported fire incidents is 7 minutes. This is comparable to the state median value.
The median response time in Roma, TX compared to nearest cities:
(Note: Based on data for all years, including only cities with at least 500 fire incidents)
| Roma: | 7 minutes |
| Rio Grande City: | 8 minutes |
 25.5% incidents where reported in the morning and 74.5% in the evening. The most fires (15.5%) took place on Tuesday, and the least (12.7%) on Friday.
 Based on the 2,016 reports from years 2003 - 2018 most fires (11.9%) took place during January, and the least (4.1%) in November.
 Out of all 3,748 cases reported during the years 2003 - 2018, the most belonged to the categories: Fire (53.8%), Rescue & EMS (22.5%), and Service Call (11.2%).
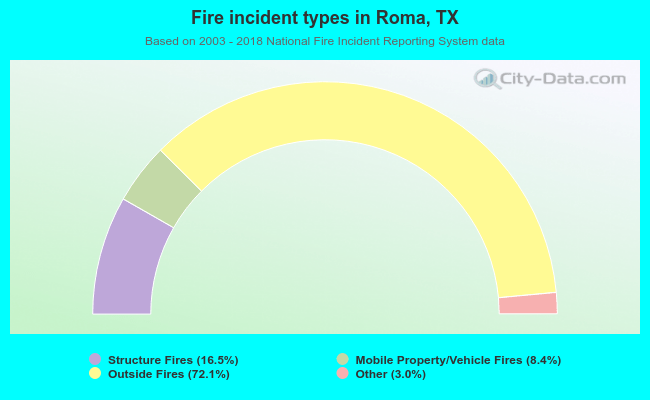 When looking into fire subcategories, the most incidents belonged to: Outside Fires (72.1%), and Structure Fires (16.5%).