Roanoke: Fire Incidents, Virginia (VA)
Where are fire incidents reported in Roanoke, VA
Something went wrong! Please refresh the page.
| Fire incidents reported | |
|---|---|
| Sreet name | Count |
| HERSHBERGER RD NW | 302 |
| MELROSE AVE NW | 270 |
| VALLEY VIEW BLVD NW | 224 |
| ELECTRIC RD | 214 |
| FRANKLIN RD SW | 180 |
| WILLIAMSON RD | 154 |
| SPRINGBEAUTY ST | 152 |
| HERSHBERGER RD | 142 |
| ORANGE AVE NE | 138 |
| BRAMBLETON AVE | 124 |
| WILLIAMSON RD NE | 122 |
| BRANDON AVE SW | 118 |
| BLUEBELL LN | 114 |
| HAWTHORNE RD | 108 |
| WILLIAMSON RD NW | 108 |
| FRANKLIN RD | 102 |
| JEFFERSON ST SE | 98 |
| 81 | 92 |
| HANOVER AVE NW | 92 |
| PETERS CREEK RD NW | 92 |
| CHAPMAN AVE SW | 88 |
| CAMPBELL AVE SW | 84 |
| PETERS CREEK RD | 84 |
| CENTRE AVE NW | 82 |
| ELM AVE SW | 82 |
| 9TH ST SE | 80 |
| PATTERSON AVE SW | 80 |
| SALEM AVE SW | 80 |
| WESTSIDE BLVD NW | 80 |
| DALE AVE SE | 78 |
| Other | 5,557 |
2003 - 2018 National Fire Incident Reporting System (NFIRS) incidents
- Incident types reported to NFIRS in Roanoke, VA
- 129,65975.0%Rescue & EMS
- 13,3677.7%Hazardous Condition
- 9,3215.4%Fire
- 7,9704.6%Good Intent Call
- 6,9214.0%False Alarm
- 5,2843.1%Service Call
- 1840.1%Overpressure Rupture
- Fire incident types reported to NFIRS in Roanoke, VA
- 3,78540.6%Structure Fires
- 3,55638.2%Outside Fires
- 1,55016.6%Mobile Property/Vehicle Fires
- 4304.6%Other
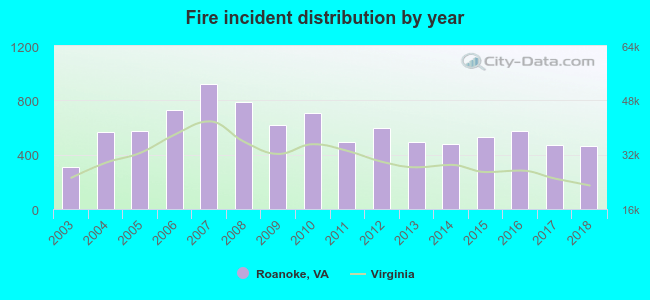 According to the data from the years 2003 - 2018 the average number of fires per year is 583. The highest number of fire incidents - 922 took place in 2007, and the least - 310 in 2003. The data has a rising trend.
The average number of yearly fire incidents per 10k residents in Roanoke, VA compared to nearest cities:
(Note: Based on data for the last 3 years, including only cities with population 5,000 and above)
| Roanoke: | 50.6 |
| Vinton: | 79.9 |
| Hollins: | 1.4 |
| Salem: | 28.3 |
| Bedford: | 163.4 |
| Blacksburg: | 22.0 |
| Christiansburg: | 55.5 |
| Covington: | 69.5 |
| Radford: | 30.4 |
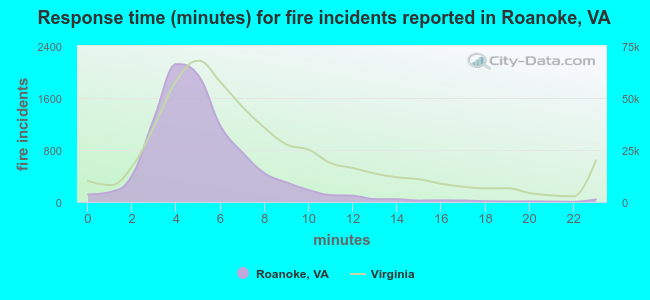 The median response time based on all reported fire incidents is 5 minutes. This is lower than the Virginia median value.
The median response time in Roanoke, VA compared to nearest cities:
(Note: Based on data for all years, including only cities with at least 500 fire incidents)
| Roanoke: | 5 minutes |
| Vinton: | 10 minutes |
| Salem: | 5 minutes |
| Blue Ridge: | 11 minutes |
| Troutville: | 9 minutes |
| Rocky Mount: | 10 minutes |
| Buchanan: | 14 minutes |
| Bedford: | 10 minutes |
| Blacksburg: | 5 minutes |
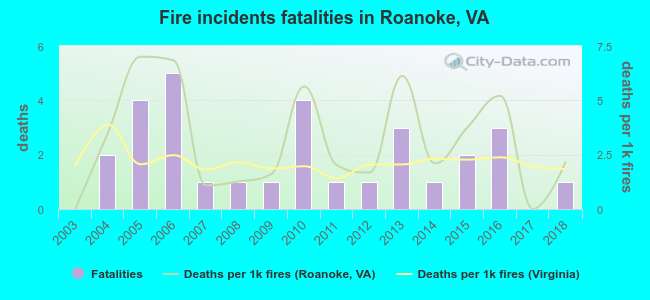 According to the reports from the years 2003 - 2018 the average number of fire-related fatalities per year is 2. The highest number of reported deaths - 5 took place in 2006, and the lowest - 0 in 2003. The data has an increasing trend.
The average number of deaths per 1,000 fires is 3. This indicator was the highest - 7 in 2005, and the lowest 0 in 2003. The trend for fatalities per 1,000 fires is increasing. Compared to the Virginia value the number of deaths per 1,000 fire incidents is higher.
According to the reports from the years 2003 - 2018 the average number of fire-related fatalities per year is 2. The highest number of reported deaths - 5 took place in 2006, and the lowest - 0 in 2003. The data has an increasing trend.
The average number of deaths per 1,000 fires is 3. This indicator was the highest - 7 in 2005, and the lowest 0 in 2003. The trend for fatalities per 1,000 fires is increasing. Compared to the Virginia value the number of deaths per 1,000 fire incidents is higher.Deaths per 1,000 incidents in Roanoke, VA compared to nearest cities:
(Note: Based on data for all years, including only cities with at least 2,500 fire incidents)
| Roanoke: | 3.2 |
| Blacksburg: | 1.2 |
| Martinsville: | 6.6 |
| Lynchburg: | 1.7 |
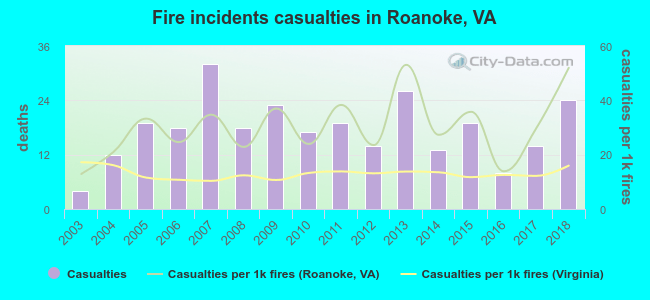 According to the data from the years 2003 - 2018 the average number of fire-related casualties per year is 18. The highest number of reported injuries - 32 took place in 2007, and the lowest - 4 in 2003. The data has an increasing trend.
The average number of injuries per 1,000 fires is 30. This indicator was the highest - 53 in 2013, and the lowest 13 in 2003. The trend for injuries per 1,000 fires is rising. Compared to the Virginia value the number of injuries per 1,000 incidents is much higher.
According to the data from the years 2003 - 2018 the average number of fire-related casualties per year is 18. The highest number of reported injuries - 32 took place in 2007, and the lowest - 4 in 2003. The data has an increasing trend.
The average number of injuries per 1,000 fires is 30. This indicator was the highest - 53 in 2013, and the lowest 13 in 2003. The trend for injuries per 1,000 fires is rising. Compared to the Virginia value the number of injuries per 1,000 incidents is much higher.Casualties per 1,000 incidents in Roanoke, VA compared to nearest cities:
(Note: Based on data for all years, including only cities with at least 500 fire incidents)
| Roanoke: | 30.3 |
| Vinton: | 1.8 |
| Salem: | 13.5 |
| Blue Ridge: | 4.0 |
| Troutville: | 1.3 |
| Rocky Mount: | 1.2 |
| Buchanan: | 0.0 |
| Bedford: | 1.5 |
| Blacksburg: | 13.3 |
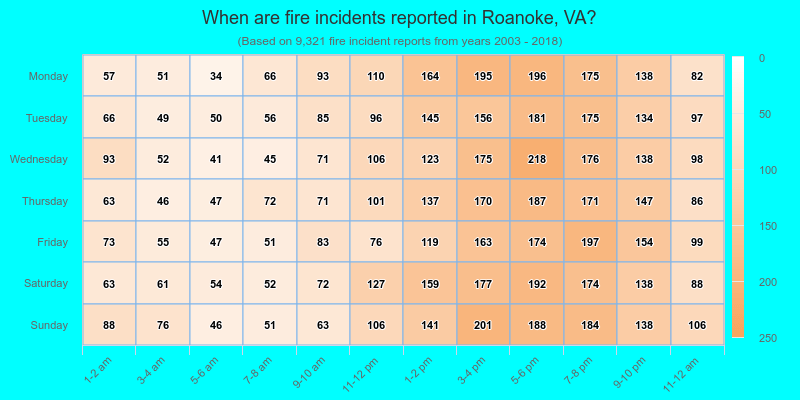
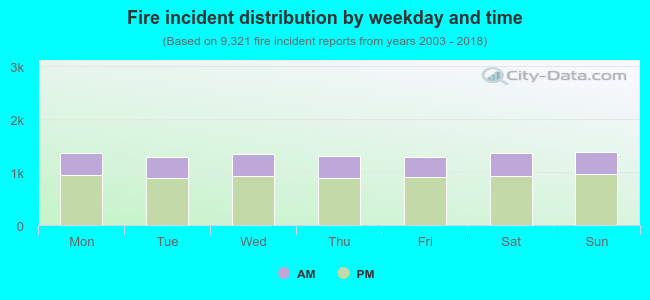 30.7% incidents where reported in the morning and 69.3% in the evening. The most fires (14.9%) took place on Sunday, and the least (13.8%) on Tuesday.
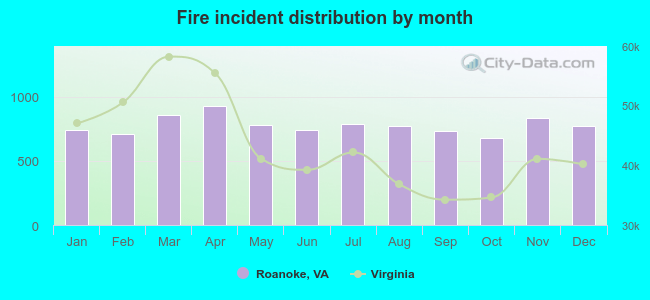 Based on the 9,321 incident reports from years 2003 - 2018 most fires (10.0%) took place during April, and the least (7.3%) in October.
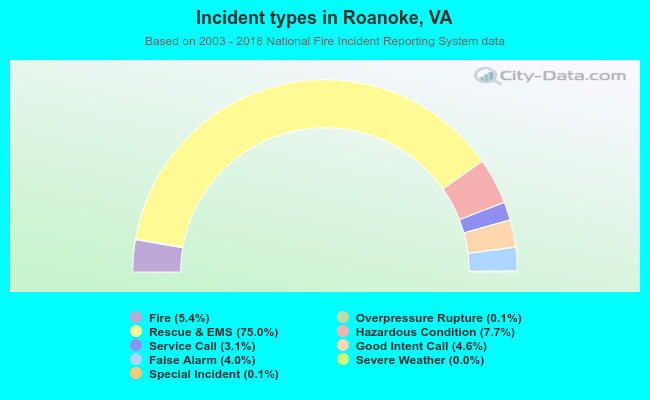 Out of all 172,906 cases reported during the years 2003 - 2018, the most belonged to the categories: Rescue & EMS (75.0%), Hazardous Condition (7.7%), and Fire (5.4%).
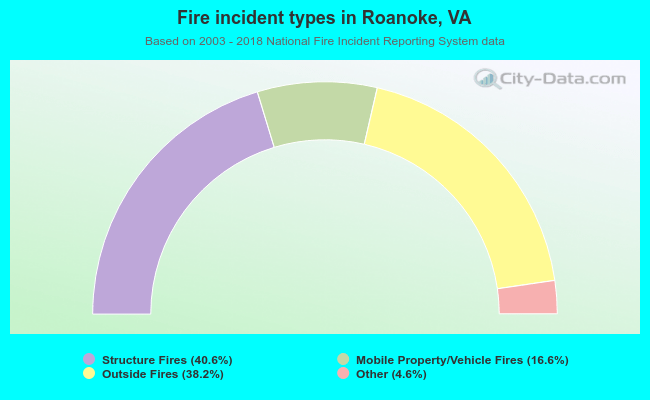 When looking into fire subcategories, the most reports belonged to: Structure Fires (40.6%), and Outside Fires (38.2%).