River Oaks: Fire Incidents, Texas (TX)
Where are fire incidents reported in River Oaks, TX
Something went wrong! Please refresh the page.
|
| |||||||||||||||||||||||||||||||||||||||||||||||||||||||||||||||||||||||||||||||||||||||||||||||||||||||||||||
2003 - 2018 National Fire Incident Reporting System (NFIRS) incidents
- Incident types reported to NFIRS in River Oaks, TX
- 73236.2%Rescue & EMS
- 55127.2%Hazardous Condition
- 35817.7%Fire
- 1768.7%Good Intent Call
- 1547.6%Service Call
- 351.7%False Alarm
- 140.7%Special Incident
- 30.1%Severe Weather
- Fire incident types reported to NFIRS in River Oaks, TX
- 20055.9%Structure Fires
- 9827.4%Outside Fires
- 4512.6%Mobile Property/Vehicle Fires
- 154.2%Other
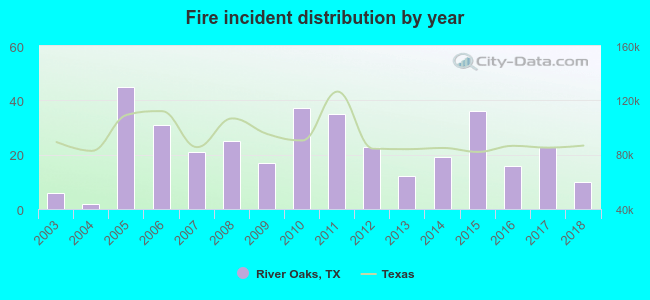 According to the data from the years 2003 - 2018 the average number of fire incidents per year is 22. The highest number of fire incidents - 45 took place in 2005, and the least - 2 in 2004. The data has a rising trend.
The average number of yearly fire incidents per 10k residents in River Oaks, TX compared to nearest cities:
(Note: Based on data for the last 3 years, including only cities with population 5,000 and above)
| River Oaks: | 21.3 |
| White Settlement: | 45.4 |
| Fort Worth: | 11.7 |
| Saginaw: | 31.8 |
| Benbrook: | 45.2 |
| Haltom City: | 42.3 |
| Eagle Mountain: | 3.4 |
| Richland Hills: | 17.8 |
| Watauga: | 29.2 |

 33.5% incidents where reported in the morning and 66.5% in the evening. The most fires (17.9%) took place on Saturday, and the least (10.3%) on Wednesday.
 According to the 358 reports from years 2003 - 2018 most fires (12.8%) took place during January, and the least (5.6%) in June.
 Out of all 2,023 cases reported during the years 2003 - 2018, the most belonged to the categories: Overpressure Rupture (36.2%), Rescue & EMS (27.2%), and Fire (17.7%).
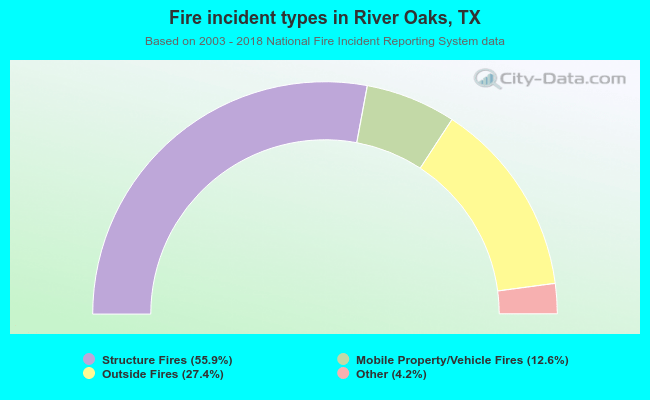 When looking into fire subcategories, the most reports belonged to: Structure Fires (55.9%), and Outside Fires (27.4%).