Ridgewood: Fire Incidents, New Jersey (NJ)
Where are fire incidents reported in Ridgewood, NJ
Something went wrong! Please refresh the page.
| Fire incidents reported | |
|---|---|
| Sreet name | Count |
| RIDGEWOOD AVE | 150 |
| FRANKLIN AVE | 78 |
| MAPLE AVE | 70 |
| VAN DIEN AVE | 58 |
| GLEN AVE | 56 |
| GODWIN AVE | 44 |
| OAK ST | 44 |
| CHESTNUT ST | 36 |
| BROAD ST | 34 |
| HILLCREST RD | 32 |
| GOFFLE RD | 28 |
| PLEASANT AVE | 24 |
| PROSPECT ST | 22 |
| DAYTON ST | 20 |
| LAKEVIEW DR | 20 |
| FRANKLIN TPKE | 18 |
| VAN NESTE SQ | 18 |
| WASHINGTON PL | 18 |
| FAIRMOUNT RD | 16 |
| SADDLE RIVER RD | 16 |
| BOGERT AVE | 14 |
| COTTAGE PL | 14 |
| GLENWOOD RD | 14 |
| GROVE ST | 14 |
| LINWOOD AVE | 14 |
| MEADOWBROOK AVE | 14 |
| MORNINGSIDE RD | 14 |
| RIDGE RD | 14 |
| WALTHERY AVE | 14 |
| ELLINGTON RD | 12 |
2002 - 2018 National Fire Incident Reporting System (NFIRS) incidents
- Incident types reported to NFIRS in Ridgewood, NJ
- 4,82135.9%Hazardous Condition
- 4,17231.1%Rescue & EMS
- 1,70312.7%False Alarm
- 1,3229.8%Service Call
- 9256.9%Fire
- 3973.0%Good Intent Call
- 470.3%Overpressure Rupture
- 360.3%Severe Weather
- Fire incident types reported to NFIRS in Ridgewood, NJ
- 51055.1%Structure Fires
- 32535.1%Outside Fires
- 869.3%Mobile Property/Vehicle Fires
- 40.4%Other
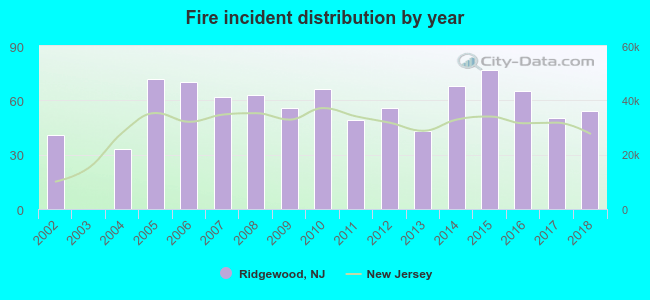 According to the data from the years 2002 - 2018 the average number of fires per year is 54. The highest number of reported fires - 77 took place in 2015, and the least - 0 in 2003. The data has an increasing trend.
The average number of yearly fire incidents per 10k residents in Ridgewood, NJ compared to nearest cities:
(Note: Based on data for the last 3 years, including only cities with population 5,000 and above)
| Ridgewood: | 22.1 |
| Midland Park: | 19.6 |
| Glen Rock: | 27.7 |
| Waldwick: | 16.8 |
| Hawthorne: | 15.5 |
| Washington Township: | 10.8 |
| Wyckoff: | 51.7 |
| Paramus: | 4.6 |
| Fair Lawn: | 22.2 |
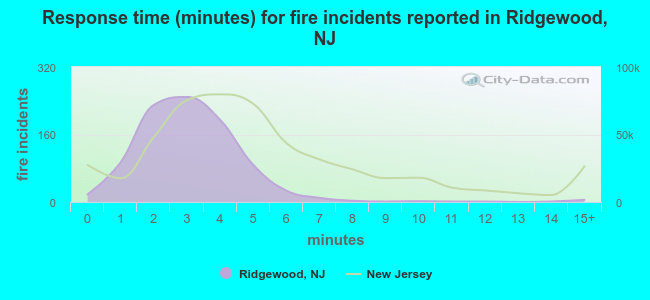 The median response time based on all reported fire incidents is 3 minutes. This is lower compared to the state median value.
The median response time in Ridgewood, NJ compared to nearest cities:
(Note: Based on data for all years, including only cities with at least 500 fire incidents)
| Ridgewood: | 3 minutes |
| Hawthorne: | 5 minutes |
| Wyckoff: | 5 minutes |
| Fair Lawn: | 5 minutes |
| Oradell: | 4 minutes |
| Paterson: | 4 minutes |
| Ramsey: | 7 minutes |
| Elmwood Park: | 5 minutes |
| Oakland: | 5 minutes |
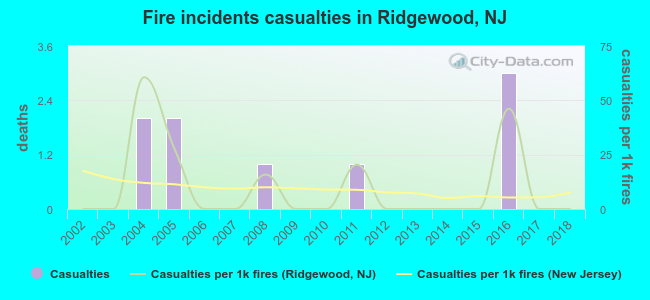 According to the data from the years 2002 - 2018 the average number of fire-related casualties per year is 1. The highest number of reported casualties - 3 took place in 2016, and the lowest - 0 in 2002. The data has a constant trend.
The average number of casualties per 1,000 fires is 10. This indicator was the highest - 61 in 2004, and the lowest 0 in 2002. The trend for casualties per 1,000 incidents is constant. Compared to the New Jersey value the number of injuries per 1,000 fires is about the same.
According to the data from the years 2002 - 2018 the average number of fire-related casualties per year is 1. The highest number of reported casualties - 3 took place in 2016, and the lowest - 0 in 2002. The data has a constant trend.
The average number of casualties per 1,000 fires is 10. This indicator was the highest - 61 in 2004, and the lowest 0 in 2002. The trend for casualties per 1,000 incidents is constant. Compared to the New Jersey value the number of injuries per 1,000 fires is about the same.
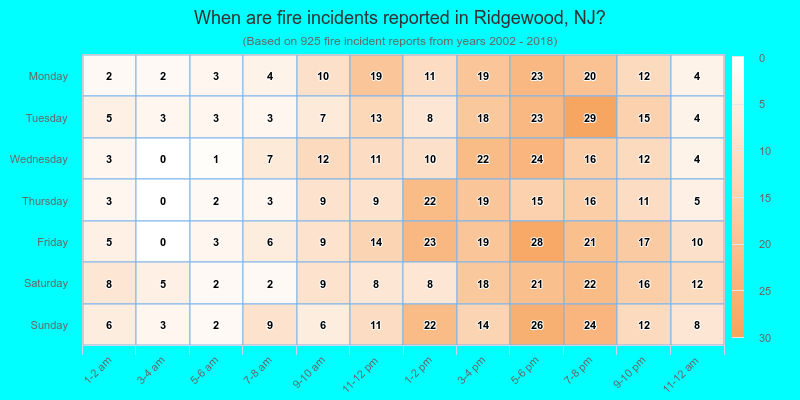
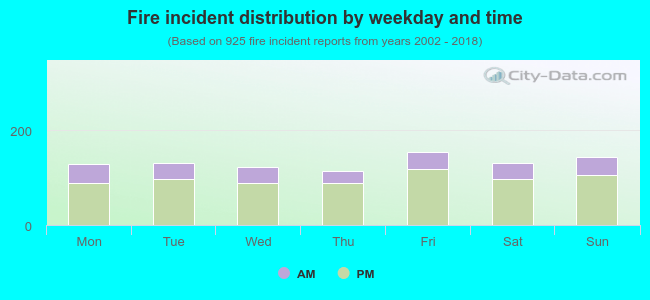 26.2% incidents where reported in the morning and 73.8% in the evening. The most fires (16.8%) took place on Friday, and the least (12.3%) on Thursday.
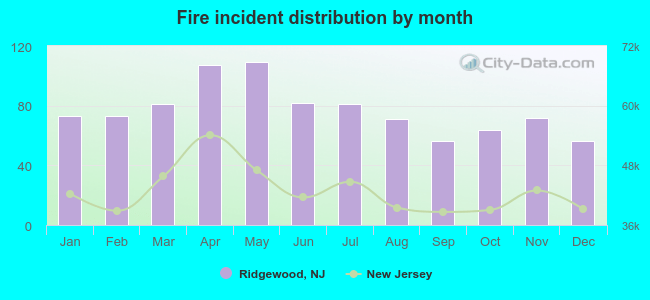 Based on the 925 fire incident reports from years 2002 - 2018 most fires (11.8%) took place during May, and the least (6.1%) in September.
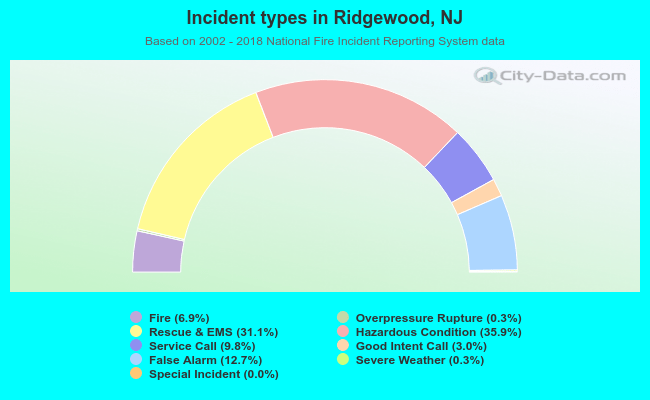 Out of all 13,429 cases reported during the years 2002 - 2018, the most belonged to the categories: Hazardous Condition (35.9%), Rescue & EMS (31.1%), and False Alarm (12.7%).
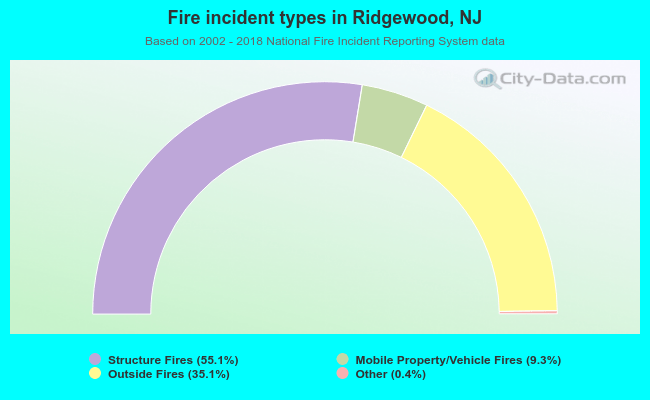 When looking into fire subcategories, the most reports belonged to: Structure Fires (55.1%), and Outside Fires (35.1%).