Portsmouth: Fire Incidents, Ohio (OH)
Where are fire incidents reported in Portsmouth, OH
Something went wrong! Please refresh the page.
| Fire incidents reported | |
|---|---|
| Sreet name | Count |
| GALLIA ST | 230 |
| 2ND ST | 196 |
| 6TH ST | 146 |
| 7TH ST | 114 |
| 3RD ST | 104 |
| 4TH ST | 104 |
| 8TH ST | 102 |
| 11TH ST | 96 |
| 5TH ST | 84 |
| 9TH ST | 68 |
| DUTCH RIDGE RD | 68 |
| WALNUT ST | 64 |
| GALLIA ST | 60 |
| MABERT RD | 58 |
| CHILLICOTHE ST | 56 |
| FINDLAY ST | 56 |
| HIGH ST | 56 |
| MARKET ST | 54 |
| BOUNDARY ST | 52 |
| SWAUGER VALLEY RD | 52 |
| UNION ST | 52 |
| 17TH ST | 50 |
| GLOVER ST | 46 |
| SR 139 | 46 |
| 15TH ST | 44 |
| ROSEMOUNT RD | 44 |
| GRANDVIEW AVE | 42 |
| JACKSON ST | 42 |
| WOODS RIDGE RD | 42 |
| ROBINSON AVE | 40 |
| Other | 980 |
2002 - 2018 National Fire Incident Reporting System (NFIRS) incidents
- Incident types reported to NFIRS in Portsmouth, OH
- 4,39533.9%Rescue & EMS
- 3,24825.1%Fire
- 1,51611.7%Service Call
- 1,41710.9%Hazardous Condition
- 1,32810.3%False Alarm
- 9247.1%Good Intent Call
- 450.3%Special Incident
- 400.3%Overpressure Rupture
- 350.3%Severe Weather
- Fire incident types reported to NFIRS in Portsmouth, OH
- 1,76154.2%Structure Fires
- 1,05432.5%Outside Fires
- 38711.9%Mobile Property/Vehicle Fires
- 461.4%Other
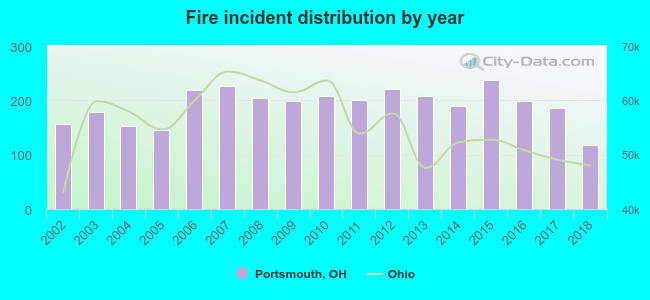 Based on the data from the years 2002 - 2018 the average number of fire incidents per year is 191. The highest number of reported fires - 238 took place in 2015, and the least - 117 in 2018. The data has a decreasing trend.
The average number of yearly fire incidents per 10k residents in Portsmouth, OH compared to nearest cities:
(Note: Based on data for the last 3 years, including only cities with population 5,000 and above)
| Portsmouth: | 82.0 |
| Wheelersburg: | 76.1 |
| Ironton: | 85.2 |
| Jackson: | 157.0 |
| Wellston: | 137.3 |
 The median response time based on all reported fire incidents is 4 minutes. This is lower than the Ohio median value.
The median response time in Portsmouth, OH compared to nearest cities:
(Note: Based on data for all years, including only cities with at least 500 fire incidents)
| Portsmouth: | 4 minutes |
| West Portsmouth: | 8 minutes |
| Wheelersburg: | 8 minutes |
| McDermott: | 12 minutes |
| Lucasville: | 12 minutes |
| Minford: | 11 minutes |
| Greenup: | 8 minutes |
| South Webster: | 11 minutes |
| Beaver: | 15 minutes |
 According to the data from the years 2002 - 2018 the average number of fire-related fatalities per year is 1. The highest number of deaths - 4 took place in 2008, and the lowest - 0 in 2002. The data has a constant trend.
The average number of fatalities per 1,000 fires is 3. This indicator was the highest - 20 in 2008, and the lowest 0 in 2002. The trend for deaths per 1,000 fire incidents is constant. Compared to the state value the number of fatalities per 1,000 fires is higher.
According to the data from the years 2002 - 2018 the average number of fire-related fatalities per year is 1. The highest number of deaths - 4 took place in 2008, and the lowest - 0 in 2002. The data has a constant trend.
The average number of fatalities per 1,000 fires is 3. This indicator was the highest - 20 in 2008, and the lowest 0 in 2002. The trend for deaths per 1,000 fire incidents is constant. Compared to the state value the number of fatalities per 1,000 fires is higher.Deaths per 1,000 incidents in Portsmouth, OH compared to nearest cities:
(Note: Based on data for all years, including only cities with at least 2,500 fire incidents)
| Portsmouth: | 3.1 |
| Ashland: | 1.2 |
 Based on the data from the years 2002 - 2018 the average number of fire-related casualties per year is 3. The highest number of injuries - 13 took place in 2011, and the lowest - 0 in 2002. The data has a rising trend.
The average number of injuries per 1,000 fire incidents is 15. This indicator was the highest - 65 in 2011, and the lowest 0 in 2002. The trend for injuries per 1,000 fire incidents is increasing. Compared to the Ohio value the number of injuries per 1,000 fire incidents is similar.
Based on the data from the years 2002 - 2018 the average number of fire-related casualties per year is 3. The highest number of injuries - 13 took place in 2011, and the lowest - 0 in 2002. The data has a rising trend.
The average number of injuries per 1,000 fire incidents is 15. This indicator was the highest - 65 in 2011, and the lowest 0 in 2002. The trend for injuries per 1,000 fire incidents is increasing. Compared to the Ohio value the number of injuries per 1,000 fire incidents is similar.Casualties per 1,000 incidents in Portsmouth, OH compared to nearest cities:
(Note: Based on data for all years, including only cities with at least 500 fire incidents)
| Portsmouth: | 15.4 |
| West Portsmouth: | 22.2 |
| Wheelersburg: | 21.6 |
| McDermott: | 6.7 |
| Lucasville: | 4.2 |
| Minford: | 0.0 |
| Greenup: | 1.7 |
| South Webster: | 0.0 |
| Beaver: | 1.4 |
 34.1% incidents where reported in the morning and 65.9% in the evening. The most fires (15.6%) took place on Tuesday, and the least (12.9%) on Thursday.
 Based on the 3,248 fires from years 2002 - 2018 most fires (9.8%) took place during April, and the least (6.9%) in February.
 Out of all 12,948 cases reported during the years 2002 - 2018, the most belonged to the categories: Rescue & EMS (33.9%), Fire (25.1%), and Service Call (11.7%).
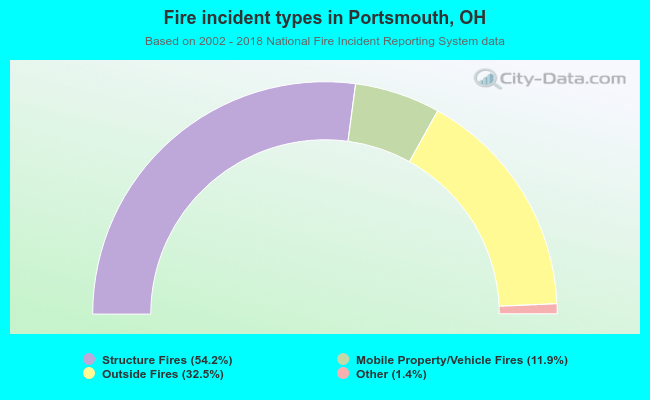 When looking into fire subcategories, the most reports belonged to: Structure Fires (54.2%), and Outside Fires (32.5%).