Port Washington: Fire Incidents, New York (NY)
Where are fire incidents reported in Port Washington, NY
Something went wrong! Please refresh the page.
|
| |||||||||||||||||||||||||||||||||||||||||||||||||||||||||||||||||||||||||||||||||||||||||||||||||||||||||||||
2006 - 2018 National Fire Incident Reporting System (NFIRS) incidents
- Incident types reported to NFIRS in Port Washington, NY
- 1,49331.8%Rescue & EMS
- 1,39729.7%Hazardous Condition
- 79416.9%False Alarm
- 65914.0%Fire
- 2555.4%Service Call
- 881.9%Good Intent Call
- 50.1%Overpressure Rupture
- 50.1%Special Incident
- Fire incident types reported to NFIRS in Port Washington, NY
- 50276.2%Structure Fires
- 6810.3%Outside Fires
- 487.3%Other
- 416.2%Mobile Property/Vehicle Fires
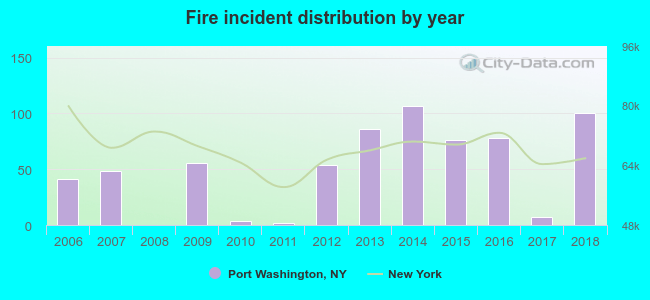 Based on the data from the years 2006 - 2018 the average number of fires per year is 51. The highest number of fire incidents - 107 took place in 2014, and the least - 0 in 2008. The data has a growing trend.
The average number of yearly fire incidents per 10k residents in Port Washington, NY compared to nearest cities:
(Note: Based on data for the last 3 years, including only cities with population 5,000 and above)
| Port Washington: | 38.9 |
| Manorhaven: | 25.4 |
| Sea Cliff: | 10.6 |
| Manhasset: | 1.2 |
| Great Neck: | 27.3 |
| Great Neck Plaza: | 2.9 |
| North Hills: | 1.9 |
| East Hills: | 9.9 |
| Roslyn Heights: | 6.6 |
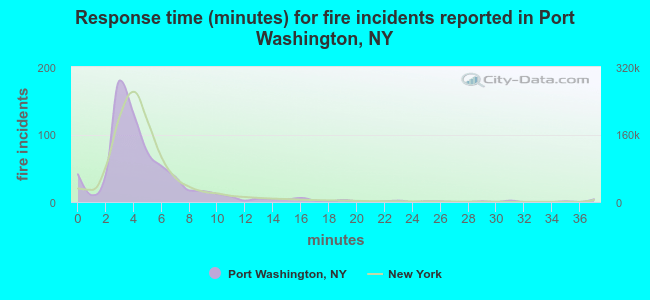 The median response time based on all reported fire incidents is 4 minutes. This is close to the state median value.
The median response time in Port Washington, NY compared to nearest cities:
(Note: Based on data for all years, including only cities with at least 500 fire incidents)
| Port Washington: | 4 minutes |
| Glen Cove: | 4 minutes |
| New Hyde Park: | 4 minutes |
| Garden City: | 3 minutes |
| Floral Park: | 2 minutes |
| Larchmont: | 2 minutes |
| New Rochelle: | 6 minutes |
| Franklin Square: | 4 minutes |
| Elmont: | 5 minutes |
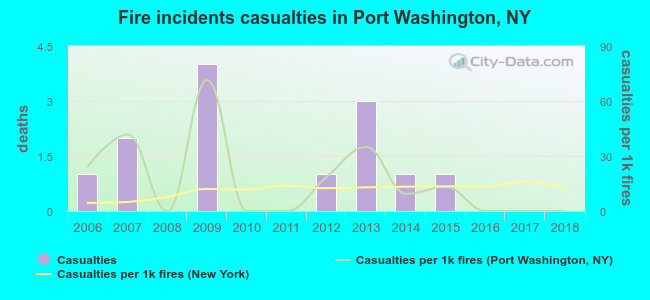 According to the data from the years 2006 - 2018 the average number of fire-related yearly casualties is 1. The highest number of casualties - 4 took place in 2009, and the lowest - 0 in 2008. The data has a decreasing trend.
The average number of casualties per 1,000 fire incidents is 16. This indicator was the highest - 71 in 2009, and the lowest 0 in 2008. The trend for casualties per 1,000 fire incidents is declining. Compared to the New York value the number of injuries per 1,000 fire incidents is higher.
According to the data from the years 2006 - 2018 the average number of fire-related yearly casualties is 1. The highest number of casualties - 4 took place in 2009, and the lowest - 0 in 2008. The data has a decreasing trend.
The average number of casualties per 1,000 fire incidents is 16. This indicator was the highest - 71 in 2009, and the lowest 0 in 2008. The trend for casualties per 1,000 fire incidents is declining. Compared to the New York value the number of injuries per 1,000 fire incidents is higher.Casualties per 1,000 incidents in Port Washington, NY compared to nearest cities:
(Note: Based on data for all years, including only cities with at least 500 fire incidents)
| Port Washington: | 19.7 |
| Glen Cove: | 0.0 |
| New Hyde Park: | 1.5 |
| Garden City: | 11.3 |
| Floral Park: | 5.9 |
| Larchmont: | 8.9 |
| New Rochelle: | 2.0 |
| Franklin Square: | 9.7 |
| Elmont: | 0.0 |
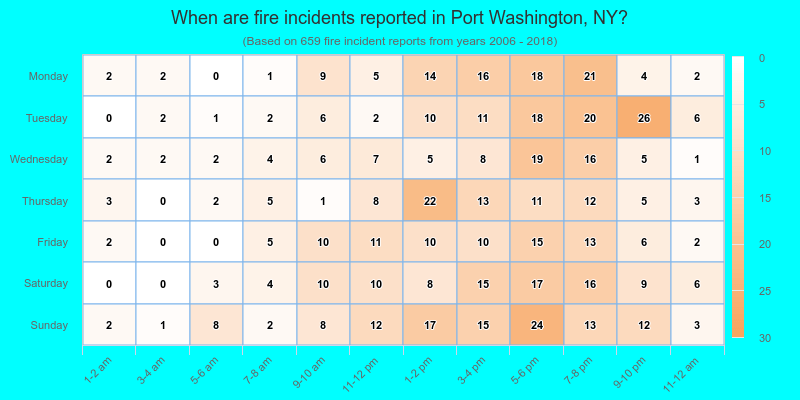
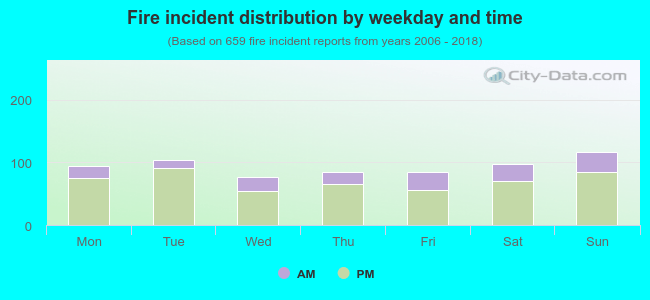 24.6% incidents where reported in the morning and 75.4% in the evening. The most fires (17.8%) took place on Sunday, and the least (11.7%) on Wednesday.
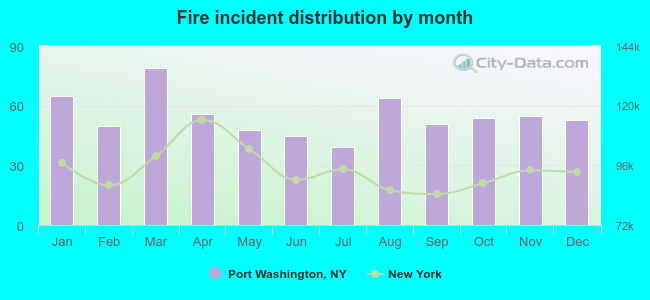 According to the 659 fires from years 2006 - 2018 most fires (12.0%) took place during March, and the least (5.9%) in July.
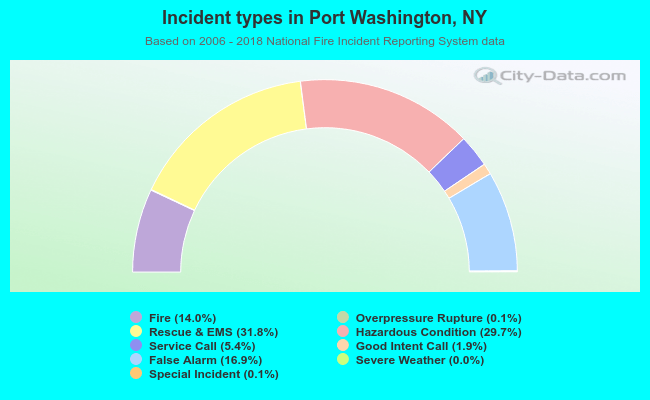 Out of all 4,698 cases reported during the years 2006 - 2018, the most belonged to the categories: Rescue & EMS (31.8%), Hazardous Condition (29.7%), and False Alarm (16.9%).
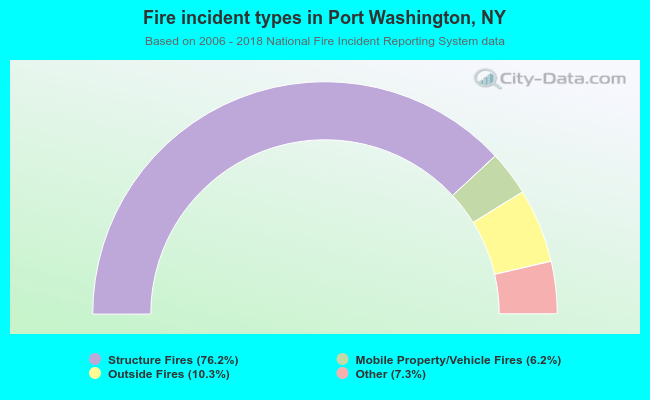 When looking into fire subcategories, the most reports belonged to: Structure Fires (76.2%), and Outside Fires (10.3%).