Pleasant Hill: Fire Incidents, California (CA)
Where are fire incidents reported in Pleasant Hill, CA
Something went wrong! Please refresh the page.
| Fire incidents reported | |
|---|---|
| Sreet name | Count |
| CONTRA COSTA BLVD | 152 |
| GOLF CLUB RD | 64 |
| BUSKIRK AVE | 44 |
| GREGORY LN | 34 |
| TAYLOR BLVD | 34 |
| CAMELBACK RD | 32 |
| MONUMENT BLVD | 32 |
| OAK PARK | 30 |
| PLEASANT HILL RD | 30 |
| SANTA BARBARA RD | 28 |
| CHILPANCINGO PKY | 24 |
| CONTRA COSTA BL | 24 |
| CRESCENT DR | 18 |
| I 680 | 18 |
| CLEAVELAND RD | 16 |
| ELLINWOOD WAY | 16 |
| BOYD RD | 14 |
| COGGINS DR | 12 |
| HAMILTON DR | 12 |
| CAMELBACK CT | 10 |
| PATTERSON BLVD | 10 |
| VIKING DR | 10 |
| WOODSWORTH LN | 10 |
| 680 | 8 |
| CAMELBACK PL | 8 |
| CRESCENT PLZ | 8 |
| GOLF CLUB WAY | 8 |
| LISA LN | 8 |
| LONGBROOK WAY | 8 |
| MAUREEN LN | 8 |
2005 - 2018 National Fire Incident Reporting System (NFIRS) incidents
- Incident types reported to NFIRS in Pleasant Hill, CA
- 4,05559.2%Rescue & EMS
- 1,04115.2%Good Intent Call
- 6809.9%Fire
- 4897.1%Hazardous Condition
- 3244.7%False Alarm
- 2583.8%Service Call
- Fire incident types reported to NFIRS in Pleasant Hill, CA
- 28642.1%Outside Fires
- 25437.4%Structure Fires
- 9614.1%Mobile Property/Vehicle Fires
- 446.5%Other
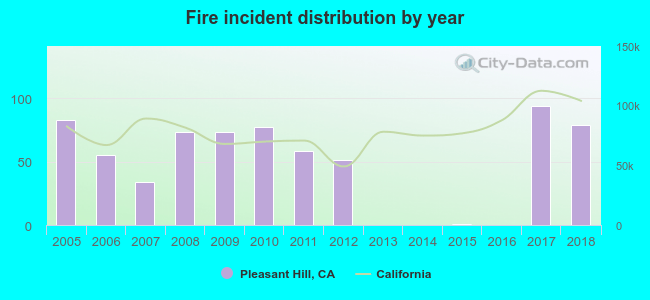 Based on the data from the years 2005 - 2018 the average number of fire incidents per year is 48. The highest number of fires - 94 took place in 2017, and the least - 0 in 2013. The data has a dropping trend.
The average number of yearly fire incidents per 10k residents in Pleasant Hill, CA compared to nearest cities:
(Note: Based on data for the last 3 years, including only cities with population 5,000 and above)
| Pleasant Hill: | 25.1 |
| Walnut Creek: | 13.3 |
| Concord: | 16.0 |
| Martinez: | 21.8 |
| Lafayette: | 18.8 |
| Alamo: | 12.1 |
| Orinda: | 26.1 |
| Clayton: | 19.4 |
| Moraga: | 14.9 |
 The median response time based on all reported fire incidents is 6 minutes. This is similar to the state median value.
The median response time in Pleasant Hill, CA compared to nearest cities:
(Note: Based on data for all years, including only cities with at least 500 fire incidents)
| Pleasant Hill: | 6 minutes |
| Walnut Creek: | 6 minutes |
| Concord: | 6 minutes |
| Martinez: | 7 minutes |
| Lafayette: | 7 minutes |
| Bay Point: | 7 minutes |
| Benicia: | 6 minutes |
| Pittsburg: | 6 minutes |
| Hercules: | 6 minutes |
 27.6% incidents where reported in the morning and 72.4% in the evening. The most fires (15.9%) took place on Monday, and the least (12.1%) on Wednesday.
 According to the 680 fires from years 2005 - 2018 most fires (13.4%) took place during July, and the least (4.9%) in February.
 Out of all 6,849 cases reported during the years 2005 - 2018, the most belonged to the categories: Overpressure Rupture (59.2%), Service Call (15.2%), and Fire (9.9%).
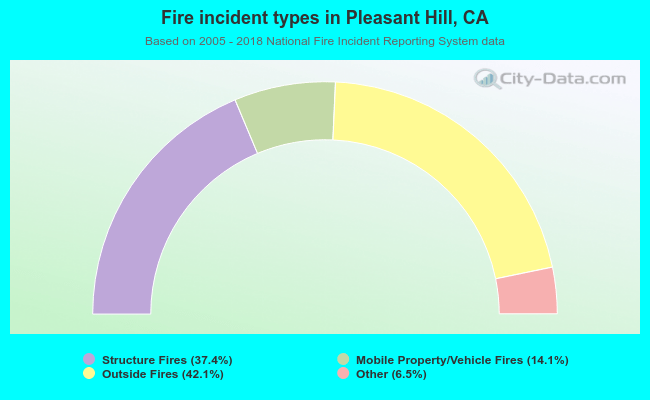 When looking into fire subcategories, the most incidents belonged to: Outside Fires (42.1%), and Structure Fires (37.4%).