Pharr: Fire Incidents, Texas (TX)
Where are fire incidents reported in Pharr, TX
Something went wrong! Please refresh the page.
| Fire incidents reported | |
|---|---|
| Sreet name | Count |
| CAGE | 450 |
| JACKSON RD | 200 |
| CAGE BLVD | 148 |
| I RD | 146 |
| EXPRESSWAY 83 | 124 |
| JACKSON | 120 |
| PECINA RD | 74 |
| BUSINESS 83 | 72 |
| LAS MILPAS RD | 72 |
| DICKER | 66 |
| NOLANA LOOP | 60 |
| DICKER DR | 58 |
| EXPRESSWAY 281 | 58 |
| MILITARY | 58 |
| THOMAS DR | 58 |
| VETERANS BLVD | 52 |
| CAFFERY AVE | 50 |
| CHEROKEE AVE | 48 |
| LONGORIA | 48 |
| NOLANA | 48 |
| PECINA | 42 |
| ANAYA | 40 |
| FERGUSON | 40 |
| EL DORA | 38 |
| HALL ACRES | 38 |
| SIOUX RD | 38 |
| SUGAR RD | 36 |
| ERICA | 34 |
| FIR | 34 |
| PARK AVE | 34 |
| Other | 429 |
2002 - 2016 National Fire Incident Reporting System (NFIRS) incidents
- Incident types reported to NFIRS in Pharr, TX
- 3,36530.7%Rescue & EMS
- 2,81325.6%Fire
- 1,94617.7%Hazardous Condition
- 1,15710.5%Service Call
- 9758.9%False Alarm
- 6776.2%Good Intent Call
- 220.2%Overpressure Rupture
- Fire incident types reported to NFIRS in Pharr, TX
- 1,55955.4%Outside Fires
- 60221.4%Mobile Property/Vehicle Fires
- 51218.2%Structure Fires
- 1405.0%Other
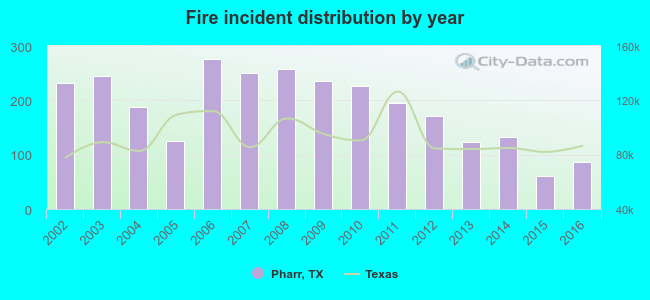 Based on the data from the years 2002 - 2016 the average number of fire incidents per year is 187. The highest number of reported fires - 276 took place in 2006, and the least - 61 in 2015. The data has a dropping trend.
 The median response time based on all reported fire incidents is 4 minutes. This is lower than the Texas median value.
The median response time in Pharr, TX compared to nearest cities:
(Note: Based on data for all years, including only cities with at least 500 fire incidents)
| Pharr: | 4 minutes |
| San Juan: | 5 minutes |
| McAllen: | 5 minutes |
| Alamo: | 5 minutes |
| Edinburg: | 7 minutes |
| Mission: | 6 minutes |
| Palmview: | 6 minutes |
| Weslaco: | 7 minutes |
| Elsa: | 5 minutes |
 Based on the reports from the years 2002 - 2016 the average number of fire-related casualties per year is 1. The highest number of reported casualties - 7 took place in 2003, and the lowest - 0 in 2004. The data has a dropping trend.
The average number of injuries per 1,000 fires is 5. This indicator was the highest - 29 in 2003, and the lowest 0 in 2004. The trend for injuries per 1,000 fire incidents is decreasing. Compared to the Texas value the number of injuries per 1,000 fires is about the same.
Based on the reports from the years 2002 - 2016 the average number of fire-related casualties per year is 1. The highest number of reported casualties - 7 took place in 2003, and the lowest - 0 in 2004. The data has a dropping trend.
The average number of injuries per 1,000 fires is 5. This indicator was the highest - 29 in 2003, and the lowest 0 in 2004. The trend for injuries per 1,000 fire incidents is decreasing. Compared to the Texas value the number of injuries per 1,000 fires is about the same.
 26.8% incidents where reported in the morning and 73.2% in the evening. The most fires (16.2%) took place on Saturday, and the least (13.5%) on Thursday.
 According to the 2,813 reports from years 2002 - 2016 most fires (13.1%) took place during January, and the least (5.7%) in September.
 Out of all 10,967 cases reported during the years 2002 - 2016, the most belonged to the categories: Rescue & EMS (30.7%), Fire (25.6%), and Hazardous Condition (17.7%).
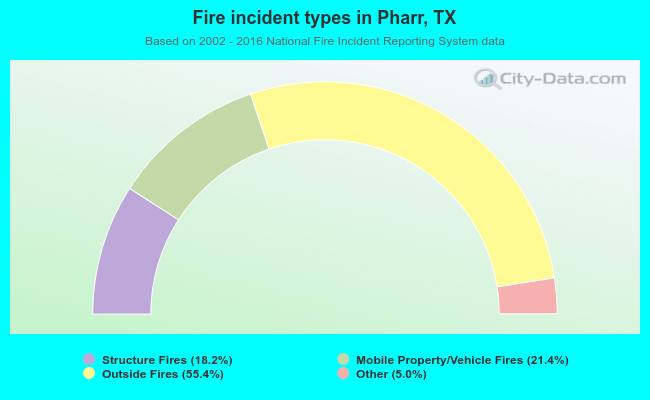 When looking into fire subcategories, the most reports belonged to: Outside Fires (55.4%), and Mobile Property/Vehicle Fires (21.4%).