Pearl City: Fire Incidents, Hawaii (HI)
Where are fire incidents reported in Pearl City, HI
Something went wrong! Please refresh the page.
| Fire incidents reported | |
|---|---|
| Sreet name | Count |
| KAM HWY | 336 |
| LEHUA AVE | 142 |
| WAIMANO HOME RD | 114 |
| KAAHUMANU ST | 102 |
| WAIHONA ST | 96 |
| KOMO MAI DR | 78 |
| H1 FWY | 68 |
| WAIAWA RD | 64 |
| ALA IKE | 58 |
| HOOKIEKIE ST | 44 |
| HOOLAULEA ST | 38 |
| KALUAMOI DR | 38 |
| KUALA ST | 38 |
| NOELANI ST | 38 |
| 3RD ST | 34 |
| H2N FWY | 34 |
| MILILANI CEMETERY RD | 24 |
| AUHUHU ST | 22 |
| ACACIA RD | 20 |
| HOOKANIKE ST | 20 |
| WAIAWA PRISON RD | 20 |
| 2ND ST | 18 |
| 4TH ST | 18 |
| HOOLI CIR | 18 |
| KAMEHAMEHA HWY | 18 |
| KAWELOKA ST | 18 |
| MOANALUA RD | 18 |
| FARRINGTON HWY | 16 |
| H2 FWY | 16 |
| HOOLA PL | 16 |
2003 - 2018 National Fire Incident Reporting System (NFIRS) incidents
- Incident types reported to NFIRS in Pearl City, HI
- 5,63257.4%Rescue & EMS
- 1,27213.0%Hazardous Condition
- 1,14811.7%Fire
- 8398.6%Good Intent Call
- 5105.2%Service Call
- 4034.1%False Alarm
- Fire incident types reported to NFIRS in Pearl City, HI
- 55848.6%Outside Fires
- 31227.2%Mobile Property/Vehicle Fires
- 27423.9%Structure Fires
- 40.3%Other
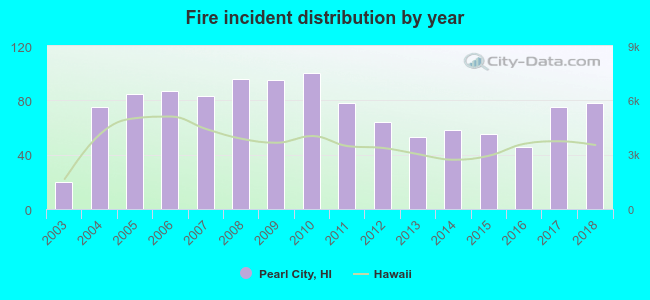 According to the data from the years 2003 - 2018 the average number of fire incidents per year is 72. The highest number of fires - 100 took place in 2010, and the least - 20 in 2003. The data has an increasing trend.
The average number of yearly fire incidents per 10k residents in Pearl City, HI compared to nearest cities:
(Note: Based on data for the last 3 years, including only cities with population 5,000 and above)
| Pearl City: | 13.9 |
| Waipio: | 11.1 |
| Aiea: | 76.7 |
| Waipahu: | 36.5 |
| Mililani Town: | 6.3 |
| Ewa Beach: | 50.4 |
| Wahiawa: | 36.5 |
| Kapolei: | 85.2 |
| Makakilo: | 2.7 |
 The median response time based on all reported fire incidents is 7 minutes. This is similar to the state median value.
The median response time in Pearl City, HI compared to nearest cities:
(Note: Based on data for all years, including only cities with at least 500 fire incidents)
| Pearl City: | 7 minutes |
| Aiea: | 7 minutes |
| Waipahu: | 7 minutes |
| Mililani Town: | 6 minutes |
| Ewa Beach: | 7 minutes |
| Wahiawa: | 6 minutes |
| Kapolei: | 7 minutes |
| Kaneohe: | 6 minutes |
| Honolulu: | 5 minutes |
 Based on the reports from the years 2003 - 2018 the average number of fire-related yearly deaths is 1. The highest number of reported deaths - 5 took place in 2004, and the lowest - 0 in 2003. The data has a growing trend.
 Based on the data from the years 2003 - 2018 the average number of fire-related casualties per year is 1. The highest number of injuries - 3 took place in 2012, and the lowest - 0 in 2003. The data has a rising trend.
The average number of casualties per 1,000 fire incidents is 12. This indicator was the highest - 47 in 2012, and the lowest 0 in 2003. The trend for injuries per 1,000 fires is rising. Compared to the state value the number of injuries per 1,000 fire incidents is much higher.
Based on the data from the years 2003 - 2018 the average number of fire-related casualties per year is 1. The highest number of injuries - 3 took place in 2012, and the lowest - 0 in 2003. The data has a rising trend.
The average number of casualties per 1,000 fire incidents is 12. This indicator was the highest - 47 in 2012, and the lowest 0 in 2003. The trend for injuries per 1,000 fires is rising. Compared to the state value the number of injuries per 1,000 fire incidents is much higher.
 38.8% incidents where reported in the morning and 61.2% in the evening. The most fires (15.9%) took place on Saturday, and the least (11.1%) on Tuesday.
 According to the 1,148 fire incidents from years 2003 - 2018 most fires (10.7%) took place during July, and the least (5.9%) in September.
 Out of all 9,805 cases reported during the years 2003 - 2018, the most belonged to the categories: Rescue & EMS (57.4%), Hazardous Condition (13.0%), and Fire (11.7%).
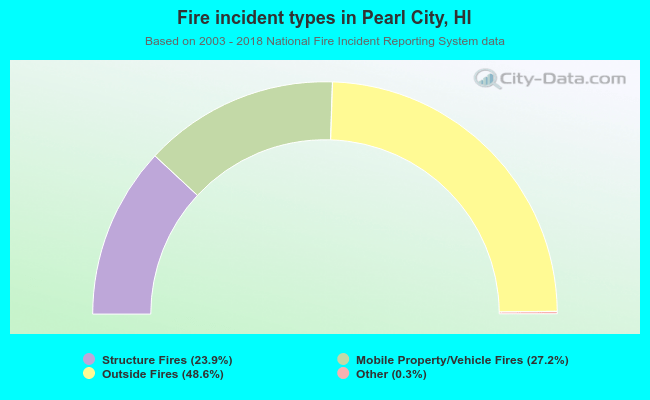 When looking into fire subcategories, the most incidents belonged to: Outside Fires (48.6%), and Mobile Property/Vehicle Fires (27.2%).