Paris: Fire Incidents, Texas (TX)
Where are fire incidents reported in Paris, TX
Something went wrong! Please refresh the page.
| Fire incidents reported | |
|---|---|
| Sreet name | Count |
| LOOP 286 | 284 |
| LAMAR AVE | 212 |
| CLARKSVILLE ST | 192 |
| BONHAM ST | 174 |
| MAIN ST | 160 |
| 19TH ST | 112 |
| 3RD ST | 76 |
| CHERRY ST | 76 |
| WASHINGTON ST | 66 |
| FM 1500 | 64 |
| KAUFMAN ST | 64 |
| 13TH ST | 60 |
| 7TH ST | 58 |
| PINE BLUFF ST | 58 |
| PRICE ST | 58 |
| GRAHAM ST | 56 |
| 6TH ST | 54 |
| HOUSTON ST | 52 |
| FM 1499 | 50 |
| CR 32500 | 48 |
| 14TH ST | 46 |
| CHURCH ST | 46 |
| PINE MILL RD | 46 |
| 17TH ST | 44 |
| 4TH ST | 44 |
| 5TH ST | 44 |
| 8TH ST | 42 |
| AUSTIN ST | 42 |
| FM 195 | 42 |
| FM 79 | 40 |
| Other | 1,880 |
2003 - 2018 National Fire Incident Reporting System (NFIRS) incidents
- Incident types reported to NFIRS in Paris, TX
- 5,42830.4%Rescue & EMS
- 4,29024.1%Fire
- 2,73115.3%Hazardous Condition
- 2,29512.9%Service Call
- 1,77510.0%Good Intent Call
- 1,1416.4%False Alarm
- 1220.7%Severe Weather
- 340.2%Overpressure Rupture
- Fire incident types reported to NFIRS in Paris, TX
- 1,90444.4%Outside Fires
- 1,73740.5%Structure Fires
- 54812.8%Mobile Property/Vehicle Fires
- 1012.4%Other
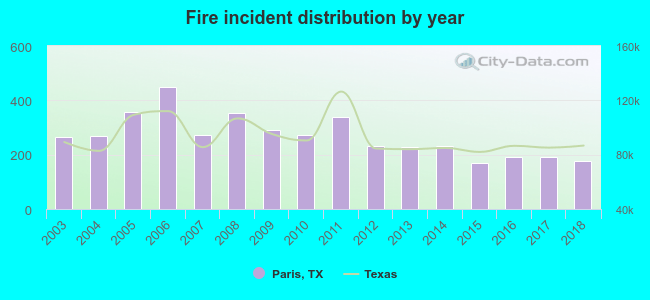 According to the data from the years 2003 - 2018 the average number of fire incidents per year is 268. The highest number of reported fires - 448 took place in 2006, and the least - 168 in 2015. The data has a declining trend.
The average number of yearly fire incidents per 10k residents in Paris, TX compared to nearest cities:
(Note: Based on data for the last 3 years, including only cities with population 5,000 and above)
| Paris: | 75.2 |
| Commerce: | 140.7 |
| Sulphur Springs: | 99.7 |
| Bonham: | 63.3 |
| Mount Pleasant: | 39.6 |
| Greenville: | 80.1 |
 The median response time based on all reported fire incidents is 5 minutes. This is lower compared to the Texas median value.
The median response time in Paris, TX compared to nearest cities:
(Note: Based on data for all years, including only cities with at least 500 fire incidents)
| Paris: | 5 minutes |
| Reno: | 10 minutes |
| Blossom: | 14 minutes |
| Powderly: | 13 minutes |
| Cooper: | 10 minutes |
| Bogata: | 12 minutes |
| Hugo: | 5 minutes |
| Clarksville: | 5 minutes |
| Commerce: | 5 minutes |
 According to the data from the years 2003 - 2018 the average number of fire-related fatalities per year is 1. The highest number of deaths - 5 took place in 2009, and the lowest - 0 in 2004. The data has a decreasing trend.
The average number of fatalities per 1,000 fires is 3. This indicator was the highest - 17 in 2009, and the lowest 0 in 2004. The trend for fatalities per 1,000 fire incidents is decreasing. Compared to the Texas value the number of fatalities per 1,000 fire incidents is higher.
According to the data from the years 2003 - 2018 the average number of fire-related fatalities per year is 1. The highest number of deaths - 5 took place in 2009, and the lowest - 0 in 2004. The data has a decreasing trend.
The average number of fatalities per 1,000 fires is 3. This indicator was the highest - 17 in 2009, and the lowest 0 in 2004. The trend for fatalities per 1,000 fire incidents is decreasing. Compared to the Texas value the number of fatalities per 1,000 fire incidents is higher.Deaths per 1,000 incidents in Paris, TX compared to nearest cities:
(Note: Based on data for all years, including only cities with at least 2,500 fire incidents)
| Paris: | 3.0 |
| Sulphur Springs: | 2.0 |
| Greenville: | 2.1 |
 According to the reports from the years 2003 - 2018 the average number of fire-related casualties per year is 3. The highest number of casualties - 8 took place in 2011, and the lowest - 0 in 2003. The data has an increasing trend.
The average number of casualties per 1,000 fire incidents is 12. This indicator was the highest - 31 in 2017, and the lowest 0 in 2003. The trend for casualties per 1,000 incidents is increasing. Compared to the state value the number of injuries per 1,000 incidents is higher.
According to the reports from the years 2003 - 2018 the average number of fire-related casualties per year is 3. The highest number of casualties - 8 took place in 2011, and the lowest - 0 in 2003. The data has an increasing trend.
The average number of casualties per 1,000 fire incidents is 12. This indicator was the highest - 31 in 2017, and the lowest 0 in 2003. The trend for casualties per 1,000 incidents is increasing. Compared to the state value the number of injuries per 1,000 incidents is higher.
 28.3% incidents where reported in the morning and 71.7% in the evening. The most fires (15.2%) took place on Friday, and the least (13.5%) on Monday.
 According to the 4,290 incident reports from years 2003 - 2018 most fires (11.1%) took place during July, and the least (6.3%) in May.
 Out of all 17,826 cases reported during the years 2003 - 2018, the most belonged to the categories: Rescue & EMS (30.4%), Fire (24.1%), and Hazardous Condition (15.3%).
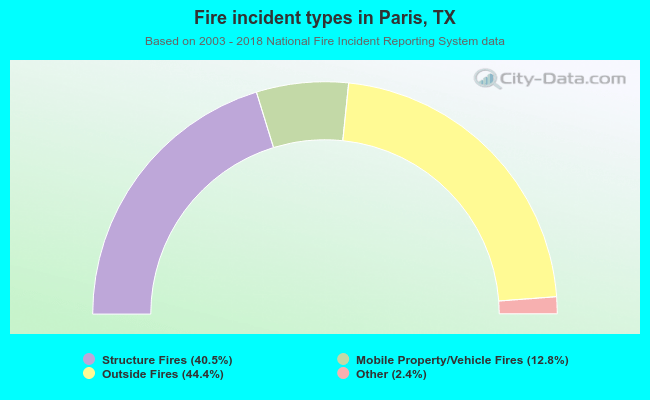 When looking into fire subcategories, the most reports belonged to: Outside Fires (44.4%), and Structure Fires (40.5%).