Palestine: Fire Incidents, Texas (TX)
Where are fire incidents reported in Palestine, TX
Something went wrong! Please refresh the page.
| Fire incidents reported | |
|---|---|
| Sreet name | Count |
| LOOP 256 LOOP | 230 |
| JACKSON ST | 184 |
| OAK ST | 160 |
| PALESTINE AVE | 148 |
| FM 315 | 104 |
| SYCAMORE ST | 76 |
| CROCKETT RD | 72 |
| REAGAN ST | 70 |
| ACR 404 | 56 |
| LACY ST | 52 |
| QUEEN ST | 52 |
| SPRING ST | 52 |
| WEST POINT TAP RD | 48 |
| ACR 441 | 46 |
| HIGHWAY 155 | 40 |
| SALT WORKS RD | 38 |
| TILE FACTORY RD | 38 |
| COURT DR | 30 |
| DORRANCE ST | 30 |
| MURCHISON ST | 30 |
| MEMORY LA | 28 |
| OLD ELKHART RD | 28 |
| ROYALL ST | 28 |
| SUGAR LA | 28 |
| FM 320 | 26 |
| MAGNOLIA ST | 26 |
| SYLVAN ST | 26 |
| VARIAH ST | 26 |
| LINK ST | 24 |
| HWY 155 | 22 |
| Other | 741 |
2002 - 2018 National Fire Incident Reporting System (NFIRS) incidents
- Incident types reported to NFIRS in Palestine, TX
- 5,68347.7%Hazardous Condition
- 2,55921.5%Fire
- 1,32111.1%Rescue & EMS
- 1,0148.5%Service Call
- 6435.4%False Alarm
- 6215.2%Good Intent Call
- 430.4%Special Incident
- 220.2%Overpressure Rupture
- Fire incident types reported to NFIRS in Palestine, TX
- 1,40654.9%Outside Fires
- 70627.6%Structure Fires
- 33713.2%Mobile Property/Vehicle Fires
- 1104.3%Other
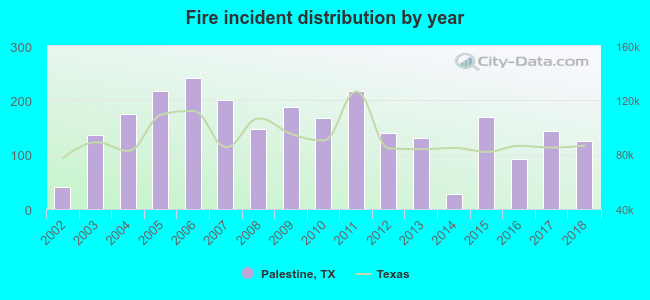 According to the data from the years 2002 - 2018 the average number of fires per year is 151. The highest number of reported fire incidents - 242 took place in 2006, and the least - 27 in 2014. The data has an increasing trend.
The average number of yearly fire incidents per 10k residents in Palestine, TX compared to nearest cities:
(Note: Based on data for the last 3 years, including only cities with population 5,000 and above)
| Palestine: | 65.4 |
| Jacksonville: | 25.2 |
| Rusk: | 1.8 |
| Crockett: | 76.2 |
| Athens: | 166.9 |
| Whitehouse: | 45.6 |
| Tyler: | 29.8 |
| Gun Barrel City: | 119.2 |
| Mexia: | 23.1 |
 The median response time based on all reported fire incidents is 5 minutes. This is lower than the Texas median value.
The median response time in Palestine, TX compared to nearest cities:
(Note: Based on data for all years, including only cities with at least 500 fire incidents)
| Palestine: | 5 minutes |
| Grapeland: | 11 minutes |
| Frankston: | 10 minutes |
| Jacksonville: | 6 minutes |
| Fairfield: | 16 minutes |
| Crockett: | 7 minutes |
| Bullard: | 10 minutes |
| Athens: | 7 minutes |
| Malakoff: | 10 minutes |
 According to the reports from the years 2002 - 2018 the average number of fire-related fatalities per year is 1. The highest number of reported deaths - 2 took place in 2002, and the lowest - 0 in 2005. The data has a dropping trend.
The average number of deaths per 1,000 fires is 5. This indicator was the highest - 50 in 2002, and the lowest 0 in 2005. The trend for fatalities per 1,000 fires is declining. Compared to the state value the number of fatalities per 1,000 fire incidents is much higher.
According to the reports from the years 2002 - 2018 the average number of fire-related fatalities per year is 1. The highest number of reported deaths - 2 took place in 2002, and the lowest - 0 in 2005. The data has a dropping trend.
The average number of deaths per 1,000 fires is 5. This indicator was the highest - 50 in 2002, and the lowest 0 in 2005. The trend for fatalities per 1,000 fires is declining. Compared to the state value the number of fatalities per 1,000 fire incidents is much higher.
 According to the data from the years 2002 - 2018 the average number of fire-related casualties per year is 0. The highest number of casualties - 2 took place in 2004, and the lowest - 0 in 2002. The data has a constant trend.
The average number of casualties per 1,000 fire incidents is 3. This indicator was the highest - 11 in 2004, and the lowest 0 in 2002. The trend for injuries per 1,000 incidents is constant. Compared to the Texas value the number of injuries per 1,000 incidents is much lower.
According to the data from the years 2002 - 2018 the average number of fire-related casualties per year is 0. The highest number of casualties - 2 took place in 2004, and the lowest - 0 in 2002. The data has a constant trend.
The average number of casualties per 1,000 fire incidents is 3. This indicator was the highest - 11 in 2004, and the lowest 0 in 2002. The trend for injuries per 1,000 incidents is constant. Compared to the Texas value the number of injuries per 1,000 incidents is much lower.
 27.9% incidents where reported in the morning and 72.1% in the evening. The most fires (17.3%) took place on Saturday, and the least (12.9%) on Thursday.
 Based on the 2,559 fire incident reports from years 2002 - 2018 most fires (12.1%) took place during January, and the least (6.4%) in May.
 Out of all 11,917 cases reported during the years 2002 - 2018, the most belonged to the categories: Hazardous Condition (47.7%), Fire (21.5%), and Rescue & EMS (11.1%).
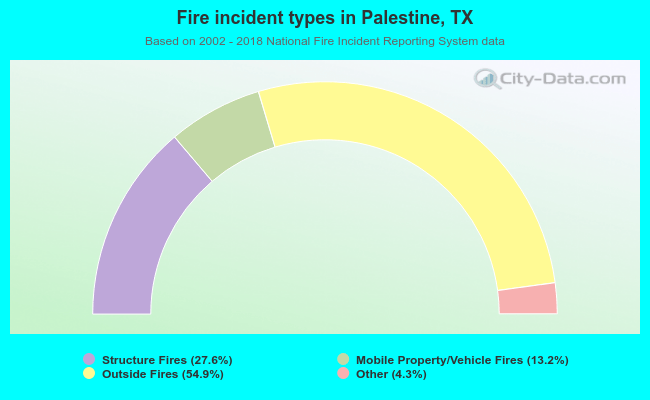 When looking into fire subcategories, the most reports belonged to: Outside Fires (54.9%), and Structure Fires (27.6%).