Oak Grove: Fire Incidents, Kentucky (KY)
Where are fire incidents reported in Oak Grove, KY
Something went wrong! Please refresh the page.
|
| |||||||||||||||||||||||||||||||||||||||||||||||||||||||||||||||||||||||||||||||||||||||||||||||||||||||||||||
2002 - 2018 National Fire Incident Reporting System (NFIRS) incidents
- Incident types reported to NFIRS in Oak Grove, KY
- 2,51951.7%Rescue & EMS
- 81416.7%Fire
- 79316.3%Good Intent Call
- 4028.2%Hazardous Condition
- 1903.9%False Alarm
- 1453.0%Service Call
- 80.2%Special Incident
- Fire incident types reported to NFIRS in Oak Grove, KY
- 29235.9%Outside Fires
- 24630.2%Structure Fires
- 21226.0%Mobile Property/Vehicle Fires
- 647.9%Other
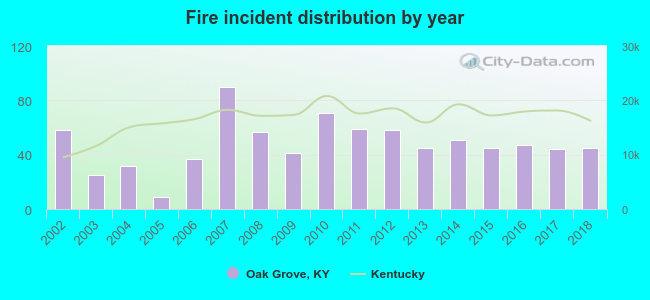 Based on the data from the years 2002 - 2018 the average number of fires per year is 48. The highest number of fires - 90 took place in 2007, and the least - 9 in 2005. The data has a decreasing trend.
The average number of yearly fire incidents per 10k residents in Oak Grove, KY compared to nearest cities:
(Note: Based on data for the last 3 years, including only cities with population 5,000 and above)
| Oak Grove: | 60.3 |
| Hopkinsville: | 52.9 |
| Russellville: | 86.2 |
| Princeton: | 50.0 |
| Fairdealing: | 1.6 |
 The median response time based on all reported fire incidents is 7 minutes. This is close to the Kentucky median value.
The median response time in Oak Grove, KY compared to nearest cities:
(Note: Based on data for all years, including only cities with at least 500 fire incidents)
| Oak Grove: | 7 minutes |
| Hopkinsville: | 6 minutes |
| Cadiz: | 13 minutes |
| Russellville: | 5 minutes |
| Greenville: | 11 minutes |
 30.3% incidents where reported in the morning and 69.7% in the evening. The most fires (16.2%) took place on Saturday, and the least (12.0%) on Sunday.
 Based on the 814 fire incident reports from years 2002 - 2018 most fires (10.7%) took place during March, and the least (4.8%) in December.
 Out of all 4,876 cases reported during the years 2002 - 2018, the most belonged to the categories: Rescue & EMS (51.7%), Fire (16.7%), and Good Intent Call (16.3%).
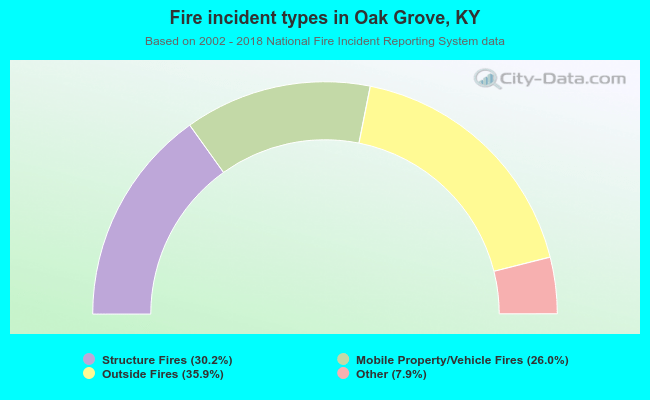 When looking into fire subcategories, the most incidents belonged to: Outside Fires (35.9%), and Structure Fires (30.2%).