Murphy: Fire Incidents, Texas (TX)
Where are fire incidents reported in Murphy, TX
Something went wrong! Please refresh the page.
|
| |||||||||||||||||||||||||||||||||||||||||||||||||||||||||||||||||||||||||||||||||||||||||||||||||||||||||||||
2003 - 2018 National Fire Incident Reporting System (NFIRS) incidents
- Incident types reported to NFIRS in Murphy, TX
- 3,14650.3%Rescue & EMS
- 83213.3%Hazardous Condition
- 66510.6%Good Intent Call
- 5468.7%Service Call
- 5408.6%False Alarm
- 4927.9%Fire
- 240.4%Severe Weather
- 80.1%Overpressure Rupture
- Fire incident types reported to NFIRS in Murphy, TX
- 24750.2%Structure Fires
- 19840.2%Outside Fires
- 367.3%Mobile Property/Vehicle Fires
- 112.2%Other
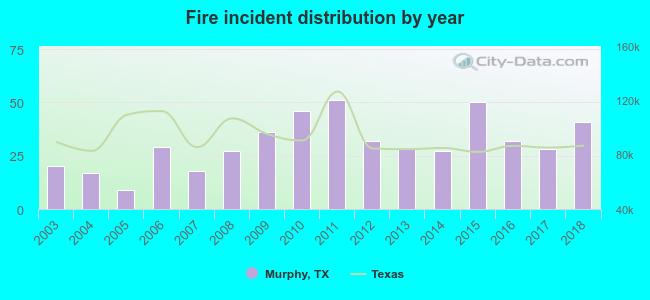 Based on the data from the years 2003 - 2018 the average number of fire incidents per year is 31. The highest number of fire incidents - 51 took place in 2011, and the least - 9 in 2005. The data has a rising trend.
The average number of yearly fire incidents per 10k residents in Murphy, TX compared to nearest cities:
(Note: Based on data for the last 3 years, including only cities with population 5,000 and above)
| Murphy: | 16.6 |
| Sachse: | 16.6 |
| Wylie: | 21.6 |
| Lucas: | 54.9 |
| Allen: | 14.0 |
| Richardson: | 18.0 |
| Garland: | 25.0 |
| Rowlett: | 17.9 |
| Plano: | 14.4 |

 Based on the reports from the years 2003 - 2018 the average number of fire-related casualties per year is 0. The highest number of reported injuries - 3 took place in 2015, and the lowest - 0 in 2003. The data has a constant trend.
 26.4% incidents where reported in the morning and 73.6% in the evening. The most fires (16.9%) took place on Tuesday, and the least (11.8%) on Monday.
 According to the 492 incident reports from years 2003 - 2018 most fires (11.4%) took place during February, and the least (4.9%) in August.
 Out of all 6,254 cases reported during the years 2003 - 2018, the most belonged to the categories: Rescue & EMS (50.3%), Hazardous Condition (13.3%), and Good Intent Call (10.6%).
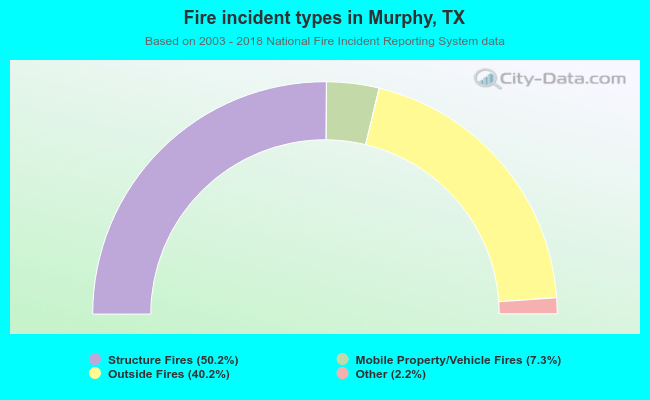 When looking into fire subcategories, the most incidents belonged to: Structure Fires (50.2%), and Outside Fires (40.2%).