Mission Viejo: Fire Incidents, California (CA)
Where are fire incidents reported in Mission Viejo, CA
Something went wrong! Please refresh the page.
| Fire incidents reported | |
|---|---|
| Sreet name | Count |
| MARGUERITE | 130 |
| CROWN VALLEY | 50 |
| ALICIA | 48 |
| LOS ALISOS | 46 |
| CHRISANTA | 42 |
| VIA FABRICANTE | 38 |
| LA PAZ | 30 |
| JERONIMO | 28 |
| SANTA MARGARITA | 24 |
| AVERY | 22 |
| CROWN VALLEY PY/MARGUERITE PY | 22 |
| OSO | 22 |
| LOS ALISOS BL/JERONIMO RD | 18 |
| TRABUCO | 18 |
| SB I5 FY/N OF OSO PY | 16 |
| LA ALAMEDA | 14 |
| LA PAZ RD E/MARGUERITE PY | 14 |
| LOS ALTOS | 14 |
| VIA ROBLE | 14 |
| CAMDEN | 12 |
| CORDILLERA | 12 |
| EL PASEO | 12 |
| MADERO | 12 |
| MUSTANG RUN | 12 |
| PACATO | 12 |
| VIA FLORECER | 12 |
| BELLOGENTE | 10 |
| CABOT | 10 |
| MARGUERITE PY/CROWN VALLEY PY | 10 |
| NB 5CROWN VALLEY | 10 |
| Other | 518 |
2005 - 2018 National Fire Incident Reporting System (NFIRS) incidents
- Incident types reported to NFIRS in Mission Viejo, CA
- 23,42075.9%Rescue & EMS
- 2,2317.2%Good Intent Call
- 1,8616.0%Service Call
- 1,2524.1%Fire
- 1,2244.0%False Alarm
- 7882.6%Hazardous Condition
- 540.2%Overpressure Rupture
- Fire incident types reported to NFIRS in Mission Viejo, CA
- 46737.3%Outside Fires
- 32926.3%Structure Fires
- 32826.2%Mobile Property/Vehicle Fires
- 12810.2%Other
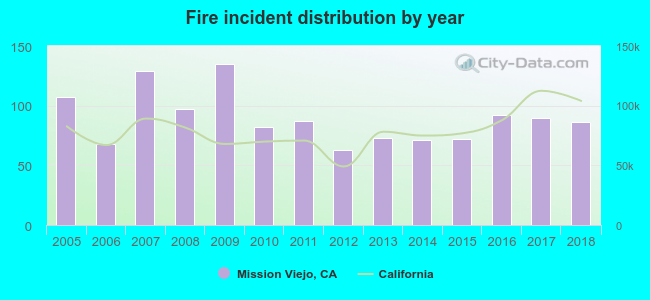 According to the data from the years 2005 - 2018 the average number of fires per year is 89. The highest number of reported fire incidents - 135 took place in 2009, and the least - 63 in 2012. The data has a declining trend.
The average number of yearly fire incidents per 10k residents in Mission Viejo, CA compared to nearest cities:
(Note: Based on data for the last 3 years, including only cities with population 5,000 and above)
| Mission Viejo: | 9.2 |
| Las Flores: | 1.7 |
| Laguna Hills: | 15.7 |
| Lake Forest: | 1.0 |
| Ladera Ranch: | 1.1 |
| Coto de Caza: | 4.5 |
| Laguna Woods: | 12.8 |
| Aliso Viejo: | 6.9 |
| Laguna Niguel: | 7.1 |
 The median response time based on all reported fire incidents is 6 minutes. This is about the same as the California median value.
The median response time in Mission Viejo, CA compared to nearest cities:
(Note: Based on data for all years, including only cities with at least 500 fire incidents)
| Mission Viejo: | 6 minutes |
| Laguna Hills: | 6 minutes |
| Laguna Niguel: | 6 minutes |
| San Juan Capistrano: | 6 minutes |
| Irvine: | 6 minutes |
| Dana Point: | 6 minutes |
| San Clemente: | 6 minutes |
| Tustin: | 6 minutes |
| Newport Beach: | 6 minutes |
 According to the reports from the years 2005 - 2018 the average number of fire-related casualties per year is 2. The highest number of injuries - 4 took place in 2007, and the lowest - 0 in 2005. The data has a rising trend.
The average number of casualties per 1,000 fires is 17. This indicator was the highest - 48 in 2012, and the lowest 0 in 2005. The trend for casualties per 1,000 fire incidents is growing. Compared to the California value the number of casualties per 1,000 fires is much higher.
According to the reports from the years 2005 - 2018 the average number of fire-related casualties per year is 2. The highest number of injuries - 4 took place in 2007, and the lowest - 0 in 2005. The data has a rising trend.
The average number of casualties per 1,000 fires is 17. This indicator was the highest - 48 in 2012, and the lowest 0 in 2005. The trend for casualties per 1,000 fire incidents is growing. Compared to the California value the number of casualties per 1,000 fires is much higher.Casualties per 1,000 incidents in Mission Viejo, CA compared to nearest cities:
(Note: Based on data for all years, including only cities with at least 500 fire incidents)
| Mission Viejo: | 16.8 |
| Laguna Hills: | 8.0 |
| Laguna Niguel: | 13.5 |
| San Juan Capistrano: | 12.7 |
| Irvine: | 15.1 |
| Dana Point: | 25.3 |
| San Clemente: | 22.0 |
| Tustin: | 20.1 |
| Newport Beach: | 3.6 |
 29.4% incidents where reported in the morning and 70.6% in the evening. The most fires (16.1%) took place on Saturday, and the least (11.8%) on Thursday.
 According to the 1,252 incident reports from years 2005 - 2018 most fires (10.9%) took place during April, and the least (5.6%) in December.
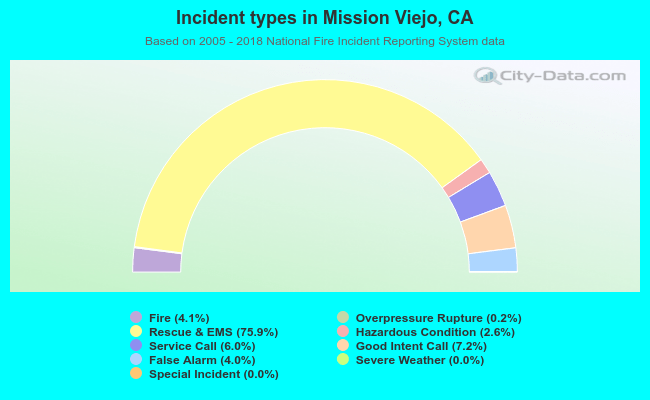 Out of all 30,843 cases reported during the years 2005 - 2018, the most belonged to the categories: Rescue & EMS (75.9%), Good Intent Call (7.2%), and Service Call (6.0%).
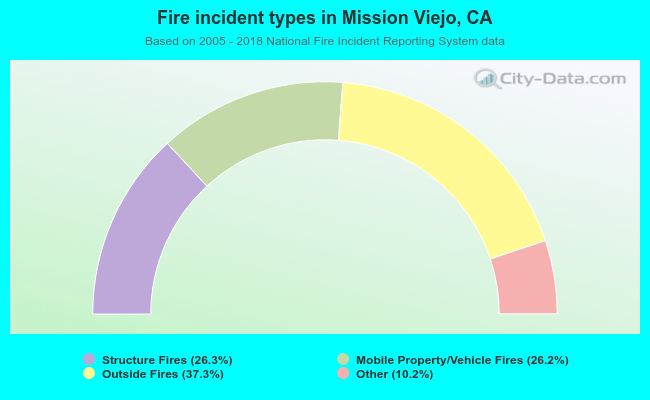 When looking into fire subcategories, the most reports belonged to: Outside Fires (37.3%), and Structure Fires (26.3%).