Miramar: Fire Incidents, Florida (FL)
Where are fire incidents reported in Miramar, FL
Something went wrong! Please refresh the page.
| Fire incidents reported | |
|---|---|
| Sreet name | Count |
| MIRAMAR PKY | 372 |
| PEMBROKE RD | 150 |
| SHERMAN CIR | 130 |
| 55TH ST | 96 |
| FOXCROFT RD | 90 |
| 160TH AVE | 86 |
| UNIVERSITY DR | 76 |
| CENTERGATE DR | 60 |
| FLAMINGO RD | 56 |
| MIRAMAR | 54 |
| FLORIDA TURNPIKE EXT | 52 |
| MIRAMAR BLVD | 52 |
| 20TH ST | 50 |
| 27TH ST | 46 |
| DOUGLAS RD | 46 |
| 18TH ST | 44 |
| 48TH CT | 44 |
| RED RD | 44 |
| 26TH ST | 42 |
| I75 RAMP | 42 |
| 29TH ST | 40 |
| I75 | 40 |
| VENETIAN ST | 40 |
| 19TH ST | 38 |
| 41ST ST | 38 |
| 21ST ST | 36 |
| 23RD ST | 36 |
| 68TH AVE | 36 |
| PRESERVE WAY | 36 |
| 30TH ST | 34 |
| Other | 1,250 |
2002 - 2018 National Fire Incident Reporting System (NFIRS) incidents
- Incident types reported to NFIRS in Miramar, FL
- 33,11863.3%Rescue & EMS
- 7,37614.1%Good Intent Call
- 3,7757.2%False Alarm
- 3,2566.2%Fire
- 2,8085.4%Hazardous Condition
- 1,9113.7%Service Call
- Fire incident types reported to NFIRS in Miramar, FL
- 1,22937.7%Structure Fires
- 99030.4%Outside Fires
- 80524.7%Mobile Property/Vehicle Fires
- 2327.1%Other
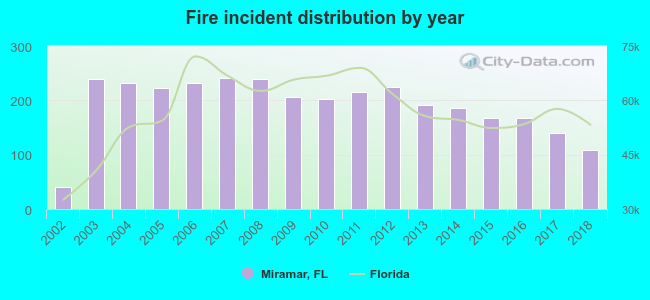 Based on the data from the years 2002 - 2018 the average number of fire incidents per year is 192. The highest number of reported fire incidents - 242 took place in 2007, and the least - 41 in 2002. The data has a growing trend.
The average number of yearly fire incidents per 10k residents in Miramar, FL compared to nearest cities:
(Note: Based on data for the last 3 years, including only cities with population 5,000 and above)
| Miramar: | 10.3 |
| Pembroke Pines: | 7.4 |
| Cooper City: | 8.4 |
| West Park: | 27.7 |
| Miami Lakes: | 11.2 |
| Southwest Ranches: | 40.8 |
| Pembroke Park: | 42.9 |
| Davie: | 21.9 |
| Hollywood: | 20.1 |
 The median response time based on all reported fire incidents is 6 minutes. This is similar to the Florida median value.
The median response time in Miramar, FL compared to nearest cities:
(Note: Based on data for all years, including only cities with at least 500 fire incidents)
| Miramar: | 6 minutes |
| Pembroke Pines: | 5 minutes |
| Cooper City: | 6 minutes |
| Miami Gardens: | 6 minutes |
| West Park: | 5 minutes |
| Southwest Ranches: | 7 minutes |
| Davie: | 7 minutes |
| Hollywood: | 6 minutes |
| North Miami Beach: | 6 minutes |
 According to the data from the years 2002 - 2018 the average number of fire-related yearly deaths is 0. The highest number of reported deaths - 1 took place in 2002, and the lowest - 0 in 2003. The data has a constant trend.
The average number of deaths per 1,000 fires is 3. This indicator was the highest - 24 in 2002, and the lowest 0 in 2003. The trend for deaths per 1,000 fire incidents is dropping. Compared to the state value the number of deaths per 1,000 fire incidents is about the same.
According to the data from the years 2002 - 2018 the average number of fire-related yearly deaths is 0. The highest number of reported deaths - 1 took place in 2002, and the lowest - 0 in 2003. The data has a constant trend.
The average number of deaths per 1,000 fires is 3. This indicator was the highest - 24 in 2002, and the lowest 0 in 2003. The trend for deaths per 1,000 fire incidents is dropping. Compared to the state value the number of deaths per 1,000 fire incidents is about the same.Deaths per 1,000 incidents in Miramar, FL compared to nearest cities:
(Note: Based on data for all years, including only cities with at least 2,500 fire incidents)
| Miramar: | 1.5 |
| Pembroke Pines: | 1.4 |
| Miami Gardens: | 0.0 |
| Davie: | 0.8 |
| Hollywood: | 1.1 |
| Plantation: | 0.4 |
 According to the data from the years 2002 - 2018 the average number of fire-related casualties per year is 3. The highest number of casualties - 15 took place in 2012, and the lowest - 0 in 2017. The data has a rising trend.
The average number of injuries per 1,000 fires is 18. This indicator was the highest - 67 in 2012, and the lowest 0 in 2017. The trend for casualties per 1,000 incidents is declining. Compared to the state value the number of casualties per 1,000 fires is higher.
According to the data from the years 2002 - 2018 the average number of fire-related casualties per year is 3. The highest number of casualties - 15 took place in 2012, and the lowest - 0 in 2017. The data has a rising trend.
The average number of injuries per 1,000 fires is 18. This indicator was the highest - 67 in 2012, and the lowest 0 in 2017. The trend for casualties per 1,000 incidents is declining. Compared to the state value the number of casualties per 1,000 fires is higher.Casualties per 1,000 incidents in Miramar, FL compared to nearest cities:
(Note: Based on data for all years, including only cities with at least 500 fire incidents)
| Miramar: | 17.8 |
| Pembroke Pines: | 31.2 |
| Cooper City: | 28.6 |
| Miami Gardens: | 0.0 |
| West Park: | 18.9 |
| Southwest Ranches: | 3.0 |
| Davie: | 14.2 |
| Hollywood: | 17.4 |
| North Miami Beach: | 0.0 |
 29.8% incidents where reported in the morning and 70.2% in the evening. The most fires (15.3%) took place on Saturday, and the least (12.9%) on Tuesday.
 According to the 3,256 reports from years 2002 - 2018 most fires (10.7%) took place during March, and the least (6.6%) in September.
 Out of all 52,316 cases reported during the years 2002 - 2018, the most belonged to the categories: Rescue & EMS (63.3%), Good Intent Call (14.1%), and False Alarm (7.2%).
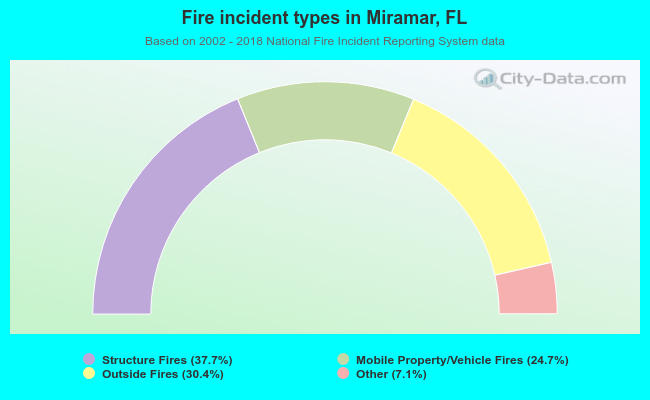 When looking into fire subcategories, the most reports belonged to: Structure Fires (37.7%), and Outside Fires (30.4%).