Milpitas: Fire Incidents, California (CA)
Where are fire incidents reported in Milpitas, CA
Something went wrong! Please refresh the page.
|
| |||||||||||||||||||||||||||||||||||||||||||||||||||||||||||||||||||||||||||||||||||||||||||||||||||||||||||||
2009 - 2018 National Fire Incident Reporting System (NFIRS) incidents
- Incident types reported to NFIRS in Milpitas, CA
- 11,41068.7%Rescue & EMS
- 1,6439.9%False Alarm
- 1,1697.0%Good Intent Call
- 9835.9%Service Call
- 7884.7%Fire
- 5523.3%Hazardous Condition
- 460.3%Special Incident
- Fire incident types reported to NFIRS in Milpitas, CA
- 27334.6%Structure Fires
- 26934.1%Outside Fires
- 15019.0%Mobile Property/Vehicle Fires
- 9612.2%Other
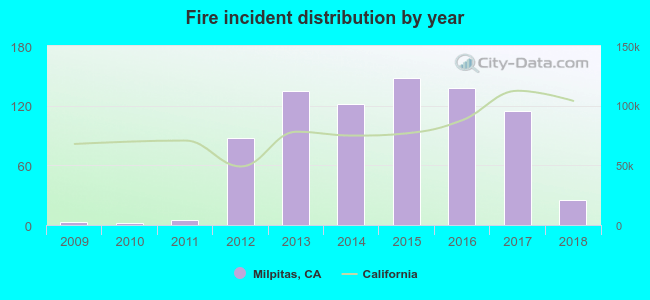 According to the data from the years 2009 - 2018 the average number of fire incidents per year is 78. The highest number of reported fires - 148 took place in 2015, and the least - 2 in 2010. The data has a growing trend.
The average number of yearly fire incidents per 10k residents in Milpitas, CA compared to nearest cities:
(Note: Based on data for the last 3 years, including only cities with population 5,000 and above)
| Milpitas: | 12.6 |
| Santa Clara: | 1.8 |
| Sunnyvale: | 9.6 |
| Fremont: | 19.8 |
| San Jose: | 15.6 |
| Newark: | 22.2 |
| Mountain View: | 5.5 |
| Campbell: | 20.7 |
| Cupertino: | 13.1 |
 The median response time based on all reported fire incidents is 5 minutes. This is lower than the state median value.
The median response time in Milpitas, CA compared to nearest cities:
(Note: Based on data for all years, including only cities with at least 500 fire incidents)
| Milpitas: | 5 minutes |
| Sunnyvale: | 5 minutes |
| Fremont: | 5 minutes |
| San Jose: | 6 minutes |
| Newark: | 4 minutes |
| Mountain View: | 5 minutes |
| Campbell: | 5 minutes |
| Cupertino: | 5 minutes |
| Palo Alto: | 6 minutes |
 30.8% incidents where reported in the morning and 69.2% in the evening. The most fires (15.6%) took place on Monday, and the least (12.8%) on Tuesday.
 Based on the 788 fire incidents from years 2009 - 2018 most fires (12.6%) took place during May, and the least (6.2%) in April.
 Out of all 16,608 cases reported during the years 2009 - 2018, the most belonged to the categories: Rescue & EMS (68.7%), False Alarm (9.9%), and Good Intent Call (7.0%).
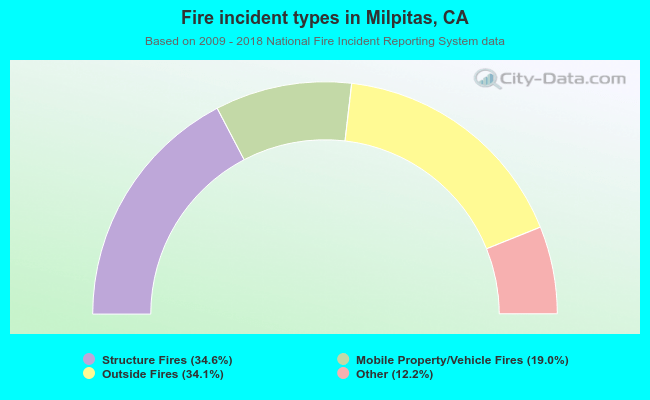 When looking into fire subcategories, the most incidents belonged to: Structure Fires (34.6%), and Outside Fires (34.1%).