Midlothian: Fire Incidents, Texas (TX)
Where are fire incidents reported in Midlothian, TX
Something went wrong! Please refresh the page.
| Fire incidents reported | |
|---|---|
| Sreet name | Count |
| WARD RD | 174 |
| HWY 287 | 126 |
| US HIGHWAY 287 | 114 |
| FM 1387 | 110 |
| HWY 67 | 110 |
| GIFCO RD | 98 |
| MAIN ST | 96 |
| MILLER RD | 96 |
| SHILOH RD | 96 |
| FM 875 | 80 |
| US HIGHWAY 67 | 74 |
| WALNUT GROVE RD | 74 |
| 9TH ST | 68 |
| V V JONES RD | 68 |
| FM 663 | 60 |
| OLD FT WORTH RD | 58 |
| MONTGOMERY RD | 50 |
| MT ZION RD | 50 |
| JOE WILSON RD | 48 |
| BUFFALO ST | 44 |
| PLAINVIEW RD | 44 |
| AVENUE F | 42 |
| SUDITH LN | 40 |
| BRYSON LN | 38 |
| DOVE LN | 38 |
| MOCKINGBIRD LN | 38 |
| WALTER STEPHENSON RD | 38 |
| REDBIRD TRL | 34 |
| WEATHERFORD RD | 34 |
| HAYES RD | 32 |
| Other | 530 |
2002 - 2018 National Fire Incident Reporting System (NFIRS) incidents
- Incident types reported to NFIRS in Midlothian, TX
- 11,87457.0%Rescue & EMS
- 2,60212.5%Fire
- 2,0469.8%Good Intent Call
- 1,9659.4%Service Call
- 1,4947.2%Hazardous Condition
- 8163.9%False Alarm
- 290.1%Overpressure Rupture
- Fire incident types reported to NFIRS in Midlothian, TX
- 1,49857.6%Outside Fires
- 75328.9%Structure Fires
- 31512.1%Mobile Property/Vehicle Fires
- 361.4%Other
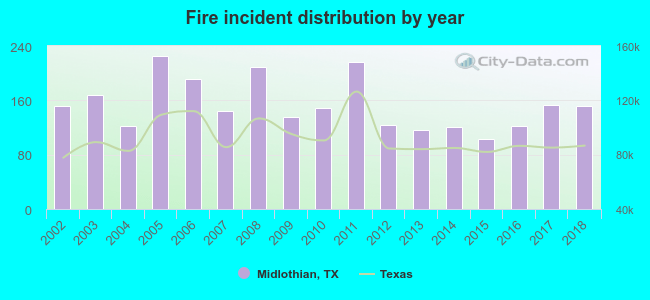 According to the data from the years 2002 - 2018 the average number of fire incidents per year is 153. The highest number of reported fire incidents - 226 took place in 2005, and the least - 103 in 2015. The data has a rising trend.
The average number of yearly fire incidents per 10k residents in Midlothian, TX compared to nearest cities:
(Note: Based on data for the last 3 years, including only cities with population 5,000 and above)
| Midlothian: | 68.0 |
| Cedar Hill: | 34.2 |
| Glenn Heights: | 40.3 |
| Waxahachie: | 49.2 |
| Mansfield: | 22.7 |
| Red Oak: | 70.4 |
| DeSoto: | 30.4 |
| Duncanville: | 46.6 |
| Lancaster: | 43.2 |
 The median response time based on all reported fire incidents is 8 minutes. This is higher compared to the state median value.
The median response time in Midlothian, TX compared to nearest cities:
(Note: Based on data for all years, including only cities with at least 500 fire incidents)
| Midlothian: | 8 minutes |
| Venus: | 13 minutes |
| Cedar Hill: | 6 minutes |
| Glenn Heights: | 5 minutes |
| Waxahachie: | 5 minutes |
| Mansfield: | 6 minutes |
| Red Oak: | 6 minutes |
| DeSoto: | 6 minutes |
| Duncanville: | 6 minutes |
 Based on the reports from the years 2002 - 2018 the average number of fire-related fatalities per year is 0. The highest number of deaths - 1 took place in 2003, and the lowest - 0 in 2002. The data has a constant trend.
The average number of fatalities per 1,000 fire incidents is 1. This indicator was the highest - 8 in 2012, and the lowest 0 in 2002. The trend for deaths per 1,000 fire incidents is constant. Compared to the Texas value the number of fatalities per 1,000 incidents is similar.
Based on the reports from the years 2002 - 2018 the average number of fire-related fatalities per year is 0. The highest number of deaths - 1 took place in 2003, and the lowest - 0 in 2002. The data has a constant trend.
The average number of fatalities per 1,000 fire incidents is 1. This indicator was the highest - 8 in 2012, and the lowest 0 in 2002. The trend for deaths per 1,000 fire incidents is constant. Compared to the Texas value the number of fatalities per 1,000 incidents is similar.Deaths per 1,000 incidents in Midlothian, TX compared to nearest cities:
(Note: Based on data for all years, including only cities with at least 2,500 fire incidents)
| Midlothian: | 1.5 |
| Cedar Hill: | 1.3 |
| Waxahachie: | 1.3 |
| Mansfield: | 0.7 |
| DeSoto: | 0.6 |
| Duncanville: | 0.8 |
| Alvarado: | 0.8 |
| Lancaster: | 1.9 |
| Grand Prairie: | 3.9 |
 Based on the data from the years 2002 - 2018 the average number of fire-related yearly casualties is 2. The highest number of casualties - 9 took place in 2003, and the lowest - 0 in 2007. The data has a decreasing trend.
The average number of injuries per 1,000 fires is 12. This indicator was the highest - 54 in 2003, and the lowest 0 in 2007. The trend for injuries per 1,000 fire incidents is decreasing. Compared to the Texas value the number of casualties per 1,000 fires is higher.
Based on the data from the years 2002 - 2018 the average number of fire-related yearly casualties is 2. The highest number of casualties - 9 took place in 2003, and the lowest - 0 in 2007. The data has a decreasing trend.
The average number of injuries per 1,000 fires is 12. This indicator was the highest - 54 in 2003, and the lowest 0 in 2007. The trend for injuries per 1,000 fire incidents is decreasing. Compared to the Texas value the number of casualties per 1,000 fires is higher.Casualties per 1,000 incidents in Midlothian, TX compared to nearest cities:
(Note: Based on data for all years, including only cities with at least 500 fire incidents)
| Midlothian: | 12.3 |
| Venus: | 3.2 |
| Cedar Hill: | 13.7 |
| Glenn Heights: | 13.0 |
| Waxahachie: | 15.5 |
| Mansfield: | 18.9 |
| Red Oak: | 5.3 |
| DeSoto: | 15.3 |
| Duncanville: | 9.0 |
 27.2% incidents where reported in the morning and 72.8% in the evening. The most fires (15.8%) took place on Saturday, and the least (13.3%) on Thursday.
 Based on the 2,602 incident reports from years 2002 - 2018 most fires (12.3%) took place during July, and the least (5.1%) in April.
 Out of all 20,849 cases reported during the years 2002 - 2018, the most belonged to the categories: Rescue & EMS (57.0%), Fire (12.5%), and Good Intent Call (9.8%).
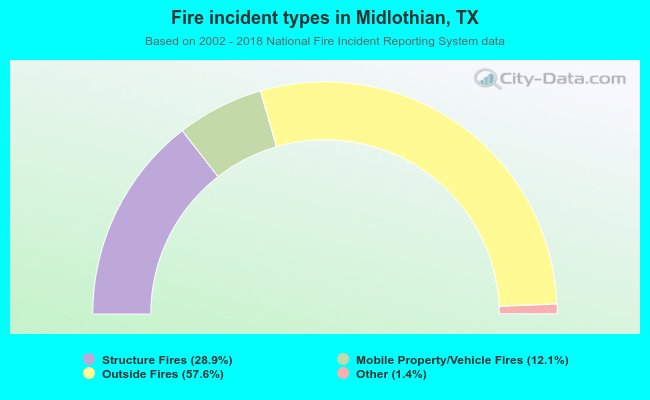 When looking into fire subcategories, the most reports belonged to: Outside Fires (57.6%), and Structure Fires (28.9%).