Melrose Park: Fire Incidents, Illinois (IL)
Where are fire incidents reported in Melrose Park, IL
Something went wrong! Please refresh the page.
| Fire incidents reported | |
|---|---|
| Sreet name | Count |
| LAKE ST | 164 |
| NORTH AVE | 158 |
| MANNHEIM RD | 114 |
| GRAND AVE | 76 |
| 25TH AVE | 68 |
| BROADWAY | 68 |
| BROADWAY AVE | 68 |
| 17TH AVE | 58 |
| 15TH AVE | 54 |
| 24TH AVE | 50 |
| DICKENS AVE | 46 |
| LAKE | 42 |
| 18TH AVE | 40 |
| 23RD AVE | 38 |
| 16TH AVE | 36 |
| 21ST AVE | 36 |
| RIVERWOODS DR | 34 |
| 22ND AVE | 30 |
| WOLF AVE | 30 |
| 1ST AVE | 28 |
| NORTH | 26 |
| PALMER AVE | 26 |
| 15TH | 24 |
| 5TH AVE | 24 |
| HAWTHORNE AVE | 24 |
| LYNDALE AVE | 24 |
| 16TH | 22 |
| 20TH AVE | 22 |
| 21ST | 22 |
| 23RD | 22 |
| Other | 71 |
2002 - 2018 National Fire Incident Reporting System (NFIRS) incidents
- Incident types reported to NFIRS in Melrose Park, IL
- 8,80755.5%Rescue & EMS
- 2,26514.3%False Alarm
- 1,5459.7%Fire
- 1,4088.9%Hazardous Condition
- 1,0436.6%Good Intent Call
- 7334.6%Service Call
- 370.2%Special Incident
- 300.2%Overpressure Rupture
- Fire incident types reported to NFIRS in Melrose Park, IL
- 82853.6%Structure Fires
- 29118.8%Mobile Property/Vehicle Fires
- 27117.5%Outside Fires
- 15510.0%Other
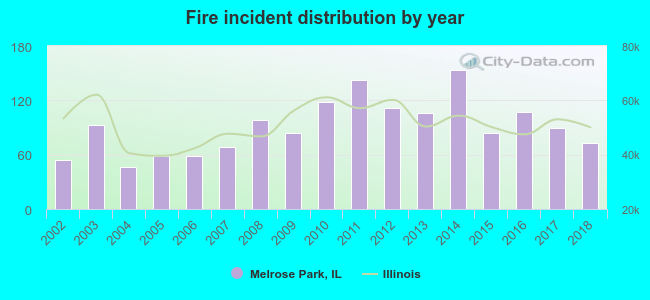 According to the data from the years 2002 - 2018 the average number of fire incidents per year is 91. The highest number of fires - 153 took place in 2014, and the least - 46 in 2004. The data has a growing trend.
The average number of yearly fire incidents per 10k residents in Melrose Park, IL compared to nearest cities:
(Note: Based on data for the last 3 years, including only cities with population 5,000 and above)
| Melrose Park: | 35.1 |
| Bellwood: | 43.3 |
| Maywood: | 58.8 |
| River Grove: | 29.2 |
| River Forest: | 50.6 |
| Northlake: | 33.7 |
| Franklin Park: | 39.5 |
| Hillside: | 67.1 |
| Berkeley: | 82.2 |
 The median response time based on all reported fire incidents is 4 minutes. This is lower than the Illinois median value.
The median response time in Melrose Park, IL compared to nearest cities:
(Note: Based on data for all years, including only cities with at least 500 fire incidents)
| Melrose Park: | 4 minutes |
| Bellwood: | 3 minutes |
| Maywood: | 3 minutes |
| River Grove: | 4 minutes |
| River Forest: | 6 minutes |
| Northlake: | 5 minutes |
| Franklin Park: | 4 minutes |
| Hillside: | 4 minutes |
| Berkeley: | 4 minutes |
 Based on the reports from the years 2002 - 2018 the average number of fire-related yearly casualties is 1. The highest number of casualties - 7 took place in 2011, and the lowest - 0 in 2002. The data has a constant trend.
The average number of injuries per 1,000 fires is 11. This indicator was the highest - 49 in 2011, and the lowest 0 in 2002. The trend for casualties per 1,000 fires is constant. Compared to the state value the number of injuries per 1,000 incidents is similar.
Based on the reports from the years 2002 - 2018 the average number of fire-related yearly casualties is 1. The highest number of casualties - 7 took place in 2011, and the lowest - 0 in 2002. The data has a constant trend.
The average number of injuries per 1,000 fires is 11. This indicator was the highest - 49 in 2011, and the lowest 0 in 2002. The trend for casualties per 1,000 fires is constant. Compared to the state value the number of injuries per 1,000 incidents is similar.Casualties per 1,000 incidents in Melrose Park, IL compared to nearest cities:
(Note: Based on data for all years, including only cities with at least 500 fire incidents)
| Melrose Park: | 12.3 |
| Bellwood: | 5.1 |
| Maywood: | 6.1 |
| River Grove: | 3.1 |
| River Forest: | 5.5 |
| Northlake: | 4.7 |
| Franklin Park: | 15.4 |
| Hillside: | 17.0 |
| Berkeley: | 7.5 |
 39.0% incidents where reported in the morning and 61.0% in the evening. The most fires (16.8%) took place on Wednesday, and the least (12.4%) on Thursday.
 Based on the 1,545 fires from years 2002 - 2018 most fires (10.2%) took place during July, and the least (6.3%) in February.
 Out of all 15,872 cases reported during the years 2002 - 2018, the most belonged to the categories: Rescue & EMS (55.5%), False Alarm (14.3%), and Fire (9.7%).
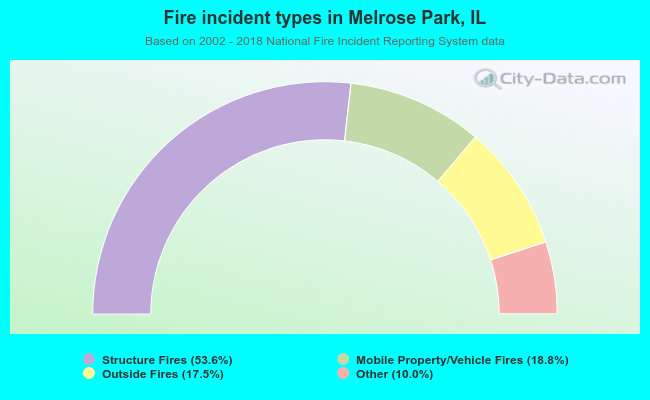 When looking into fire subcategories, the most reports belonged to: Structure Fires (53.6%), and Mobile Property/Vehicle Fires (18.8%).