Melrose: Fire Incidents, Massachusetts (MA)
Where are fire incidents reported in Melrose, MA
Something went wrong! Please refresh the page.
|
| |||||||||||||||||||||||||||||||||||||||||||||||||||||||||||||||||||||||||||||||||||||||||||||||||||||||||||||
2002 - 2018 National Fire Incident Reporting System (NFIRS) incidents
- Incident types reported to NFIRS in Melrose, MA
- 39767.5%Fire
- 9015.3%Service Call
- 498.3%Hazardous Condition
- 345.8%Rescue & EMS
- 132.2%False Alarm
- 40.7%Good Intent Call
- 10.2%Special Incident
- Fire incident types reported to NFIRS in Melrose, MA
- 26967.8%Structure Fires
- 6516.4%Mobile Property/Vehicle Fires
- 4711.8%Outside Fires
- 164.0%Other
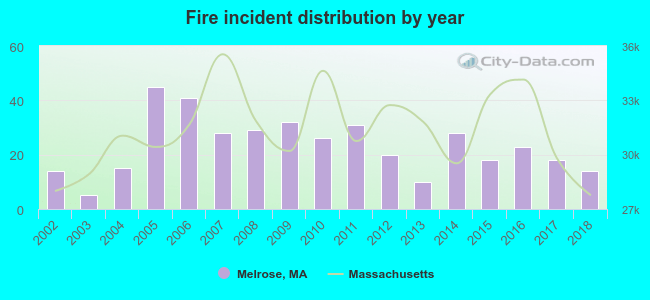 According to the data from the years 2002 - 2018 the average number of fires per year is 23. The highest number of reported fire incidents - 45 took place in 2005, and the least - 5 in 2003. The data has a constant trend.
The average number of yearly fire incidents per 10k residents in Melrose, MA compared to nearest cities:
(Note: Based on data for the last 3 years, including only cities with population 5,000 and above)
| Melrose: | 6.6 |
| Malden: | 22.3 |
| Stoneham: | 58.2 |
| Saugus: | 48.2 |
| Wakefield: | 21.3 |
| Everett: | 27.9 |
| Medford: | 41.3 |
| Winchester: | 12.9 |
| Revere: | 68.1 |

 According to the reports from the years 2002 - 2018 the average number of fire-related casualties per year is 1. The highest number of reported injuries - 4 took place in 2006, and the lowest - 0 in 2002. The data has a constant trend.
 26.4% incidents where reported in the morning and 73.6% in the evening. The most fires (18.1%) took place on Thursday, and the least (11.6%) on Friday.
 According to the 397 fire incident reports from years 2002 - 2018 most fires (11.3%) took place during January, and the least (6.8%) in November.
 Out of all 588 cases reported during the years 2002 - 2018, the most belonged to the categories: Fire (67.5%), Hazardous Condition (15.3%), and Rescue & EMS (8.3%).
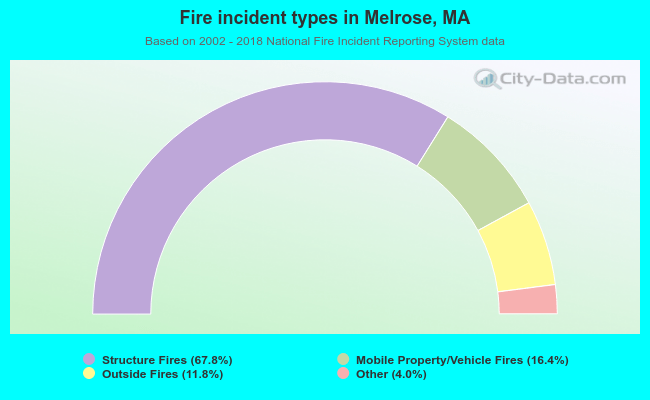 When looking into fire subcategories, the most reports belonged to: Structure Fires (67.8%), and Mobile Property/Vehicle Fires (16.4%).