McMinnville: Fire Incidents, Oregon (OR)
Where are fire incidents reported in McMinnville, OR
Something went wrong! Please refresh the page.
|
| |||||||||||||||||||||||||||||||||||||||||||||||||||||||||||||||||||||||||||||||||||||||||||||||||||||||||||||
2002 - 2018 National Fire Incident Reporting System (NFIRS) incidents
- Incident types reported to NFIRS in McMinnville, OR
- 10,20677.1%Rescue & EMS
- 8946.8%Good Intent Call
- 7535.7%Service Call
- 6595.0%Fire
- 3872.9%Hazardous Condition
- 3282.5%False Alarm
- Fire incident types reported to NFIRS in McMinnville, OR
- 27341.4%Structure Fires
- 26940.8%Outside Fires
- 9414.3%Mobile Property/Vehicle Fires
- 233.5%Other
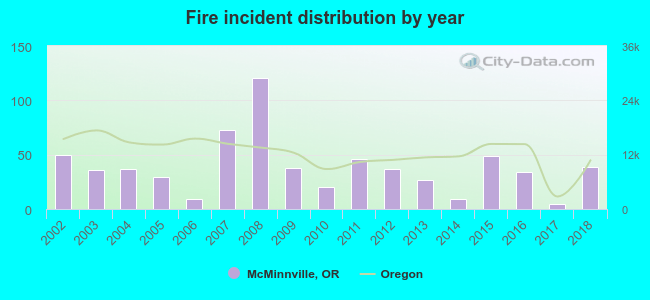 Based on the data from the years 2002 - 2018 the average number of fires per year is 39. The highest number of reported fire incidents - 121 took place in 2008, and the least - 5 in 2017. The data has a declining trend.
The average number of yearly fire incidents per 10k residents in McMinnville, OR compared to nearest cities:
(Note: Based on data for the last 3 years, including only cities with population 5,000 and above)
| McMinnville: | 7.8 |
| Sheridan: | 39.0 |
| Newberg: | 18.9 |
| Keizer: | 8.4 |
| Woodburn: | 23.9 |
| Sherwood: | 7.9 |
| Dallas: | 26.9 |
| Salem: | 25.0 |
| Forest Grove: | 29.4 |
 The median response time based on all reported fire incidents is 6 minutes. This is similar to the state median value.
The median response time in McMinnville, OR compared to nearest cities:
(Note: Based on data for all years, including only cities with at least 500 fire incidents)
| McMinnville: | 6 minutes |
| Sheridan: | 8 minutes |
| Newberg: | 6 minutes |
| Gaston: | 13 minutes |
| Keizer: | 5 minutes |
| Woodburn: | 7 minutes |
| Sherwood: | 7 minutes |
| Dallas: | 7 minutes |
| Salem: | 5 minutes |
 34.7% incidents where reported in the morning and 65.3% in the evening. The most fires (16.5%) took place on Thursday, and the least (12.1%) on Friday.
 Based on the 659 fire incidents from years 2002 - 2018 most fires (20.6%) took place during July, and the least (4.4%) in November.
 Out of all 13,237 cases reported during the years 2002 - 2018, the most belonged to the categories: Rescue & EMS (77.1%), Good Intent Call (6.8%), and Service Call (5.7%).
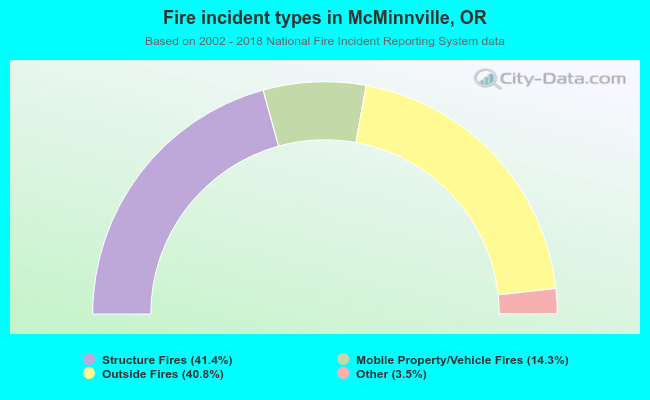 When looking into fire subcategories, the most incidents belonged to: Structure Fires (41.4%), and Outside Fires (40.8%).