Mather: Fire Incidents, California (CA)
Where are fire incidents reported in Mather, CA
Something went wrong! Please refresh the page.
|
| |||||||||||||||||||||||||||||||||||||||||||||||||||||||||||||||||||||||||||||||||||||||||||||||||||||||||||||
| Other | 1,119 | |||||||||||||||||||||||||||||||||||||||||||||||||||||||||||||||||||||||||||||||||||||||||||||||||||||||||||||
2011 - 2018 National Fire Incident Reporting System (NFIRS) incidents
- Incident types reported to NFIRS in Mather, CA
- 31,99748.1%Rescue & EMS
- 18,22727.4%Good Intent Call
- 10,11515.2%Special Incident
- 2,5933.9%Fire
- 1,6322.5%Service Call
- 1,3492.0%False Alarm
- 5830.9%Hazardous Condition
- Fire incident types reported to NFIRS in Mather, CA
- 1,26548.8%Outside Fires
- 86033.2%Structure Fires
- 2469.5%Other
- 2228.6%Mobile Property/Vehicle Fires
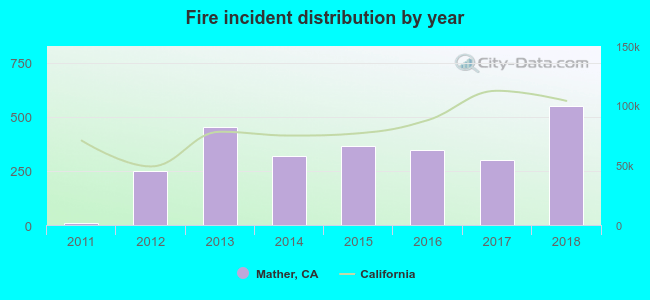 Based on the data from the years 2011 - 2018 the average number of fires per year is 324. The highest number of reported fire incidents - 551 took place in 2018, and the least - 10 in 2011. The data has an increasing trend.
The average number of yearly fire incidents per 10k residents in Mather, CA compared to nearest cities:
(Note: Based on data for the last 3 years, including only cities with population 5,000 and above)
| Mather: | 36.7 |
| Rancho Cordova: | 32.6 |
| Carmichael: | 16.0 |
| Gold River: | 2.5 |
| Fair Oaks: | 14.0 |
| North Highlands: | 46.8 |
| Citrus Heights: | 28.1 |
| Orangevale: | 13.5 |
| Florin: | 51.8 |
 The median response time based on all reported fire incidents is 6 minutes. This is close to the state median value.
The median response time in Mather, CA compared to nearest cities:
(Note: Based on data for all years, including only cities with at least 500 fire incidents)
| Mather: | 6 minutes |
| Rancho Cordova: | 5 minutes |
| Carmichael: | 5 minutes |
| Fair Oaks: | 5 minutes |
| North Highlands: | 5 minutes |
| Citrus Heights: | 5 minutes |
| Orangevale: | 5 minutes |
| Florin: | 5 minutes |
| Antelope: | 5 minutes |
 36.6% incidents where reported in the morning and 63.4% in the evening. The most fires (15.1%) took place on Saturday, and the least (13.5%) on Thursday.
 Based on the 2,593 fire incidents from years 2011 - 2018 most fires (15.0%) took place during October, and the least (4.2%) in April.
 Out of all 66,523 cases reported during the years 2011 - 2018, the most belonged to the categories: Rescue & EMS (48.1%), Good Intent Call (27.4%), and Special Incident (15.2%).
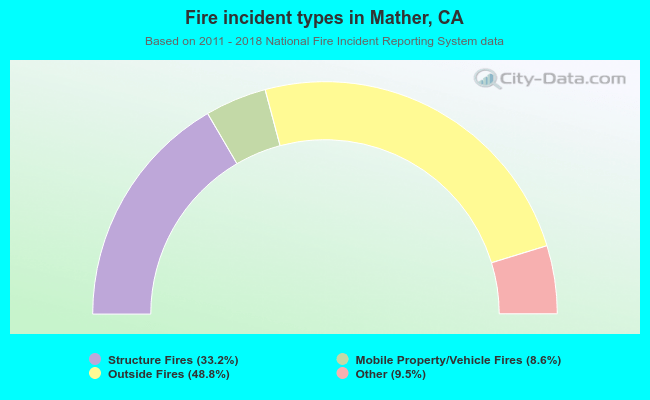 When looking into fire subcategories, the most reports belonged to: Outside Fires (48.8%), and Structure Fires (33.2%).