Marcy: Fire Incidents, New York (NY)
Where are fire incidents reported in Marcy, NY
Something went wrong! Please refresh the page.
|
| |||||||||||||||||||||||||||||||||||||||||||||||||||||||||||||||||||||||||||||||||||||||||||||||||||||||||||||
2002 - 2018 National Fire Incident Reporting System (NFIRS) incidents
- Incident types reported to NFIRS in Marcy, NY
- 2,02753.8%Rescue & EMS
- 39510.5%False Alarm
- 38610.2%Fire
- 3439.1%Hazardous Condition
- 2877.6%Service Call
- 2877.6%Good Intent Call
- 371.0%Severe Weather
- Fire incident types reported to NFIRS in Marcy, NY
- 21355.2%Structure Fires
- 9223.8%Mobile Property/Vehicle Fires
- 5614.5%Outside Fires
- 256.5%Other
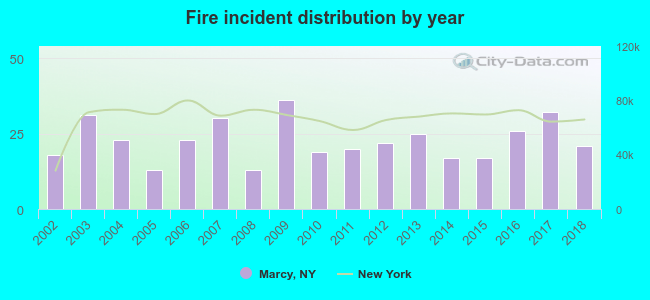 According to the data from the years 2002 - 2018 the average number of fire incidents per year is 23. The highest number of fire incidents - 36 took place in 2009, and the least - 13 in 2005. The data has a rising trend.
The average number of yearly fire incidents per 10k residents in Marcy, NY compared to nearest cities:
(Note: Based on data for the last 3 years, including only cities with population 5,000 and above)
| Marcy: | 29.3 |
| Whitestown: | 1.1 |
| Utica: | 44.8 |
| Westmoreland: | 23.4 |
| Rome: | 9.5 |
| Lee: | 1.5 |
| Ilion: | 49.4 |
| Verona: | 48.7 |
| Herkimer: | 36.4 |
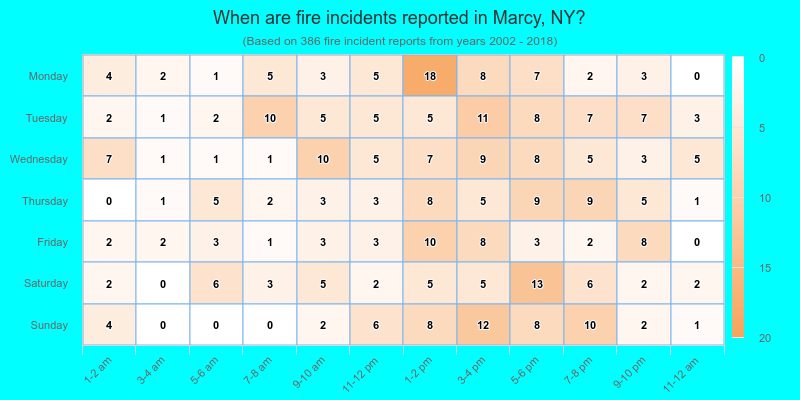
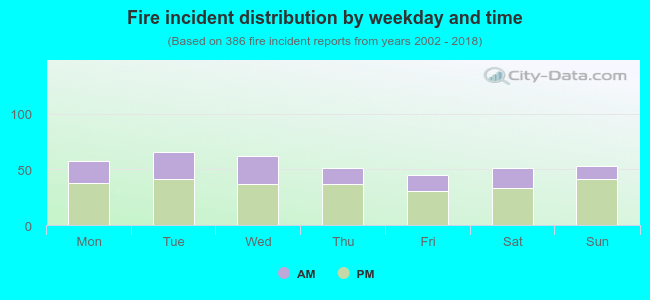 33.2% incidents where reported in the morning and 66.8% in the evening. The most fires (17.1%) took place on Tuesday, and the least (11.7%) on Friday.
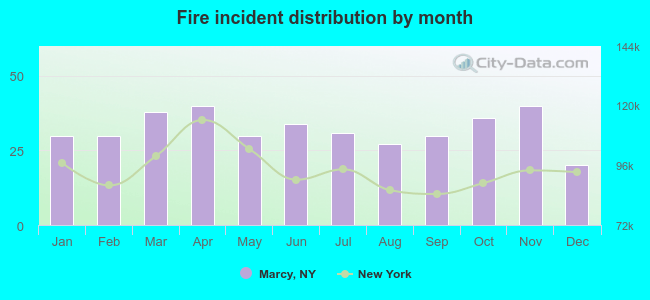 According to the 386 reports from years 2002 - 2018 most fires (10.4%) took place during April, and the least (5.2%) in December.
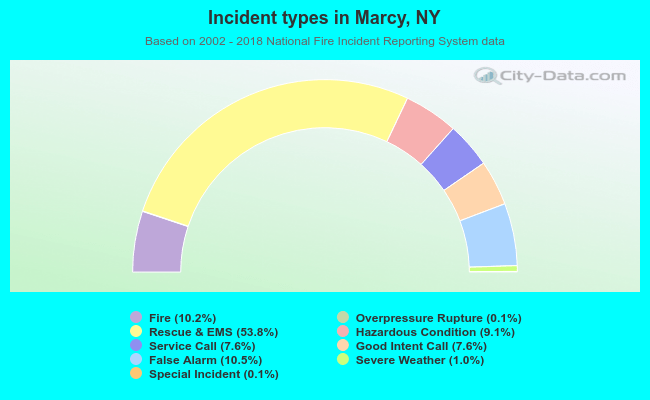 Out of all 3,766 cases reported during the years 2002 - 2018, the most belonged to the categories: Rescue & EMS (53.8%), False Alarm (10.5%), and Fire (10.2%).
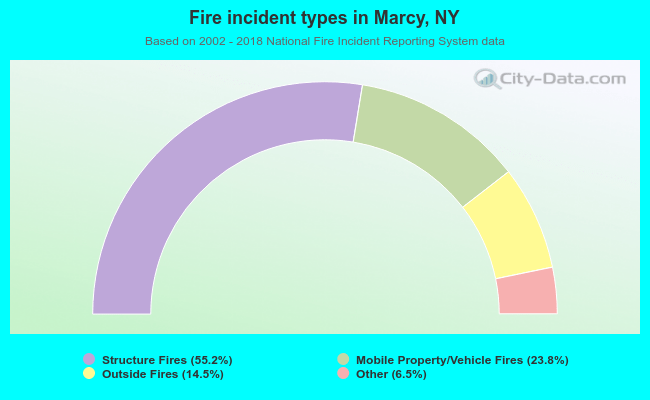 When looking into fire subcategories, the most incidents belonged to: Structure Fires (55.2%), and Mobile Property/Vehicle Fires (23.8%).