Mansfield: Fire Incidents, Massachusetts (MA)
Where are fire incidents reported in Mansfield, MA
Something went wrong! Please refresh the page.
| Fire incidents reported | |
|---|---|
| Sreet name | Count |
| SOUTH MAIN ST | 152 |
| WEST ST | 100 |
| NORTH MAIN ST | 78 |
| RTE 495 NB | 78 |
| CHAUNCY ST | 76 |
| EAST ST | 76 |
| FRANCIS AVE | 70 |
| RTE 495 SB | 62 |
| RTE 95 NB | 62 |
| FORBES BLVD | 58 |
| SCHOOL ST | 58 |
| RTE 95 SB | 54 |
| OAKLAND ST | 44 |
| GILBERT ST | 36 |
| RUMFORD AVE | 36 |
| MAPLE ST | 34 |
| PLYMOUTH ST | 34 |
| ERICK RD | 30 |
| STEARNS AVE | 30 |
| PRATT ST | 28 |
| COPELAND DR | 26 |
| MILL ST | 26 |
| BALCOM ST | 22 |
| OTIS ST | 22 |
| YORK RD | 22 |
| BONNEY LN | 20 |
| ELM ST | 18 |
| WILLIAMS ST | 18 |
| COBB ST | 16 |
| FRUIT ST | 16 |
2002 - 2018 National Fire Incident Reporting System (NFIRS) incidents
- Incident types reported to NFIRS in Mansfield, MA
- 11,17357.4%Rescue & EMS
- 2,49112.8%False Alarm
- 2,20711.3%Hazardous Condition
- 1,2686.5%Service Call
- 1,1876.1%Fire
- 1,0005.1%Good Intent Call
- 1060.5%Special Incident
- Fire incident types reported to NFIRS in Mansfield, MA
- 43836.9%Outside Fires
- 39633.4%Structure Fires
- 24120.3%Mobile Property/Vehicle Fires
- 1129.4%Other
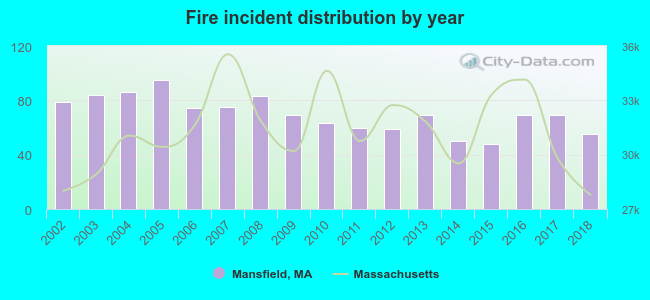 Based on the data from the years 2002 - 2018 the average number of fire incidents per year is 70. The highest number of reported fires - 95 took place in 2005, and the least - 48 in 2015. The data has a declining trend.
The average number of yearly fire incidents per 10k residents in Mansfield, MA compared to nearest cities:
(Note: Based on data for the last 3 years, including only cities with population 5,000 and above)
| Mansfield: | 27.7 |
| Foxborough: | 96.0 |
| Norton: | 20.0 |
| Plainville: | 44.0 |
| Easton: | 23.4 |
| Sharon: | 86.6 |
| Wrentham: | 20.1 |
| Attleboro: | 27.7 |
| Walpole: | 123.4 |
 The median response time based on all reported fire incidents is 5 minutes. This is higher than the state median value.
The median response time in Mansfield, MA compared to nearest cities:
(Note: Based on data for all years, including only cities with at least 500 fire incidents)
| Mansfield: | 5 minutes |
| Foxborough: | 5 minutes |
| Norton: | 4 minutes |
| Plainville: | 4 minutes |
| Easton: | 5 minutes |
| Sharon: | 5 minutes |
| Wrentham: | 2 minutes |
| Attleboro: | 4 minutes |
| Walpole: | 3 minutes |
 Based on the data from the years 2002 - 2018 the average number of fire-related yearly casualties is 2. The highest number of reported casualties - 5 took place in 2018, and the lowest - 0 in 2002. The data has a rising trend.
The average number of injuries per 1,000 fire incidents is 23. This indicator was the highest - 91 in 2018, and the lowest 0 in 2002. The trend for casualties per 1,000 incidents is rising. Compared to the state value the number of casualties per 1,000 fire incidents is much higher.
Based on the data from the years 2002 - 2018 the average number of fire-related yearly casualties is 2. The highest number of reported casualties - 5 took place in 2018, and the lowest - 0 in 2002. The data has a rising trend.
The average number of injuries per 1,000 fire incidents is 23. This indicator was the highest - 91 in 2018, and the lowest 0 in 2002. The trend for casualties per 1,000 incidents is rising. Compared to the state value the number of casualties per 1,000 fire incidents is much higher.Casualties per 1,000 incidents in Mansfield, MA compared to nearest cities:
(Note: Based on data for all years, including only cities with at least 500 fire incidents)
| Mansfield: | 21.9 |
| Foxborough: | 5.5 |
| Norton: | 18.9 |
| Plainville: | 7.6 |
| Easton: | 49.1 |
| Sharon: | 9.8 |
| Wrentham: | 0.0 |
| Attleboro: | 9.0 |
| Walpole: | 12.4 |
 28.6% incidents where reported in the morning and 71.4% in the evening. The most fires (16.8%) took place on Sunday, and the least (12.9%) on Thursday.
 According to the 1,187 fire incident reports from years 2002 - 2018 most fires (14.7%) took place during April, and the least (5.6%) in November.
 Out of all 19,462 cases reported during the years 2002 - 2018, the most belonged to the categories: Rescue & EMS (57.4%), False Alarm (12.8%), and Hazardous Condition (11.3%).
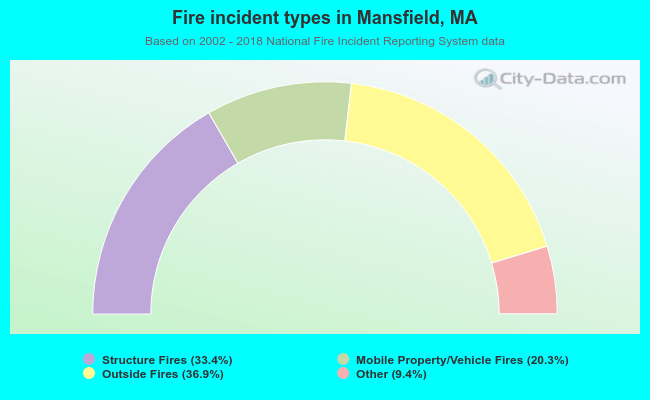 When looking into fire subcategories, the most incidents belonged to: Outside Fires (36.9%), and Structure Fires (33.4%).