Madison: Fire Incidents, Alabama (AL)
Where are fire incidents reported in Madison, AL
Something went wrong! Please refresh the page.
| Fire incidents reported | |
|---|---|
| Sreet name | Count |
| WALL TRIANA HWY | 259 |
| INTERSTATE 565 | 205 |
| ROYAL DR | 175 |
| SHELTON RD | 166 |
| MADISON BLVD | 159 |
| CAPSHAW RD | 151 |
| OLD MADISON PIKE | 128 |
| MADISON 1 BLVD | 119 |
| COUNTY LINE RD | 114 |
| HIGHWAY 72 | 95 |
| HIGHWAY 72 WEST | 88 |
| NANCE RD | 83 |
| OLD RAILROAD BED RD | 78 |
| HUGHES RD | 65 |
| HIGHWAY 72/2 HWY | 62 |
| SULLIVAN ST | 62 |
| GILLESPIE 2 RD | 61 |
| HUGHES 1 RD | 61 |
| NICK DAVIS RD | 54 |
| FLAGSTONE DR | 51 |
| WALL TRIANA 2 HWY | 50 |
| JEFF RD | 49 |
| HUGHES 2 RD | 48 |
| GILLESPIE RD | 45 |
| KYSER BLVD | 45 |
| MT ZION RD | 44 |
| OLD MADISON 1 PIKE | 44 |
| PINE GROVE RD | 44 |
| SWANCOTT RD | 41 |
| HERITAGE LN | 38 |
2003 - 2018 National Fire Incident Reporting System (NFIRS) incidents
- Incident types reported to NFIRS in Madison, AL
- 6,60661.0%Rescue & EMS
- 1,57814.6%Fire
- 9358.6%Good Intent Call
- 7537.0%Hazardous Condition
- 5505.1%False Alarm
- 3152.9%Service Call
- 610.6%Special Incident
- 220.2%Overpressure Rupture
- 110.1%Severe Weather
- Fire incident types reported to NFIRS in Madison, AL
- 79050.1%Outside Fires
- 48630.8%Structure Fires
- 26316.7%Mobile Property/Vehicle Fires
- 392.5%Other
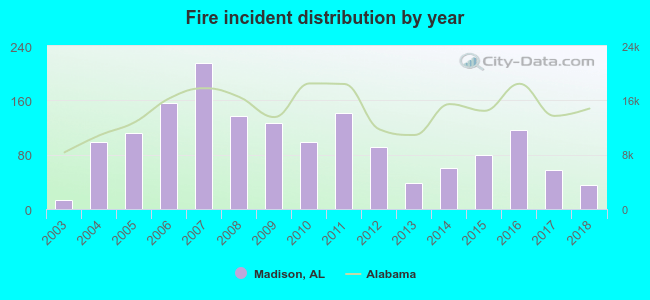 According to the data from the years 2003 - 2018 the average number of fire incidents per year is 99. The highest number of reported fire incidents - 215 took place in 2007, and the least - 13 in 2003. The data has an increasing trend.
The average number of yearly fire incidents per 10k residents in Madison, AL compared to nearest cities:
(Note: Based on data for the last 3 years, including only cities with population 5,000 and above)
| Madison: | 15.0 |
| Huntsville: | 42.6 |
| Harvest: | 30.9 |
| Athens: | 38.1 |
| Meridianville: | 14.9 |
| Decatur: | 46.8 |
| Hartselle: | 31.6 |
| Danville: | 1.6 |
| Arab: | 62.0 |
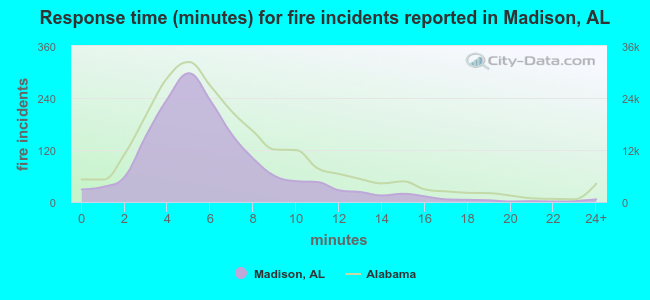 The median response time based on all reported fire incidents is 5 minutes. This is lower compared to the Alabama median value.
The median response time in Madison, AL compared to nearest cities:
(Note: Based on data for all years, including only cities with at least 500 fire incidents)
| Madison: | 5 minutes |
| Huntsville: | 5 minutes |
| Athens: | 4 minutes |
| Decatur: | 5 minutes |
| Hartselle: | 5 minutes |
| Arab: | 7 minutes |
| Vinemont: | 8 minutes |
| Moulton: | 9 minutes |
| Guntersville: | 6 minutes |
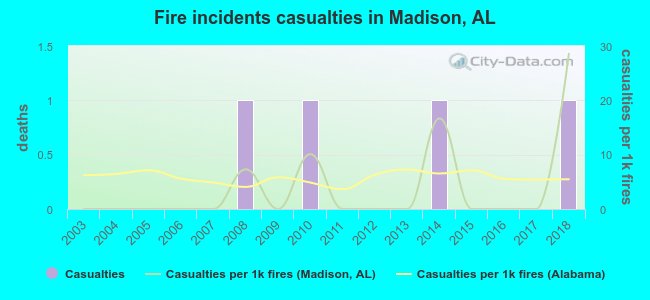 According to the reports from the years 2003 - 2018 the average number of fire-related casualties per year is 0. The highest number of reported injuries - 1 took place in 2008, and the lowest - 0 in 2003. The data has an increasing trend.
The average number of injuries per 1,000 fires is 4. This indicator was the highest - 29 in 2018, and the lowest 0 in 2003. The trend for injuries per 1,000 fire incidents is rising. Compared to the Alabama value the number of injuries per 1,000 fires is much lower.
According to the reports from the years 2003 - 2018 the average number of fire-related casualties per year is 0. The highest number of reported injuries - 1 took place in 2008, and the lowest - 0 in 2003. The data has an increasing trend.
The average number of injuries per 1,000 fires is 4. This indicator was the highest - 29 in 2018, and the lowest 0 in 2003. The trend for injuries per 1,000 fire incidents is rising. Compared to the Alabama value the number of injuries per 1,000 fires is much lower.Casualties per 1,000 incidents in Madison, AL compared to nearest cities:
(Note: Based on data for all years, including only cities with at least 500 fire incidents)
| Madison: | 2.5 |
| Huntsville: | 15.6 |
| Athens: | 6.9 |
| Decatur: | 2.7 |
| Hartselle: | 0.0 |
| Arab: | 1.3 |
| Vinemont: | 3.5 |
| Moulton: | 2.7 |
| Guntersville: | 3.8 |
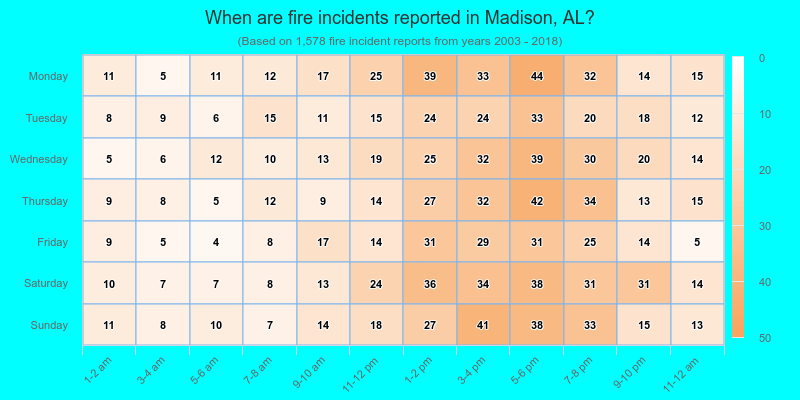
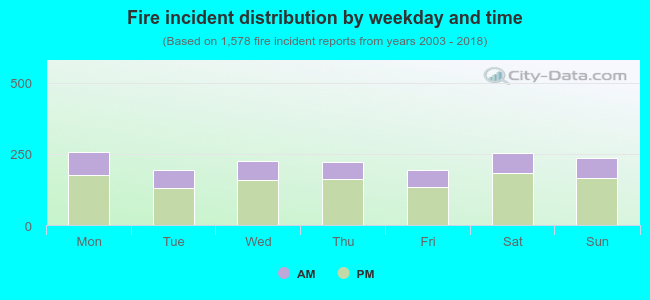 29.2% incidents where reported in the morning and 70.8% in the evening. The most fires (16.3%) took place on Monday, and the least (12.2%) on Friday.
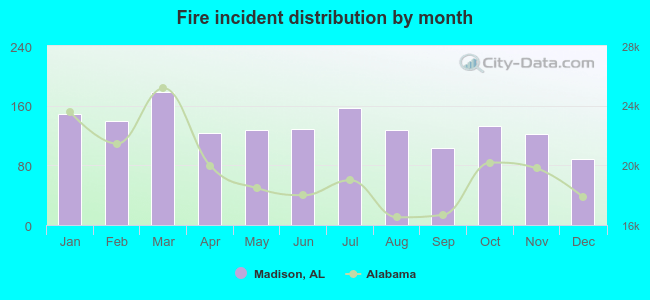 According to the 1,578 reports from years 2003 - 2018 most fires (11.3%) took place during March, and the least (5.6%) in December.
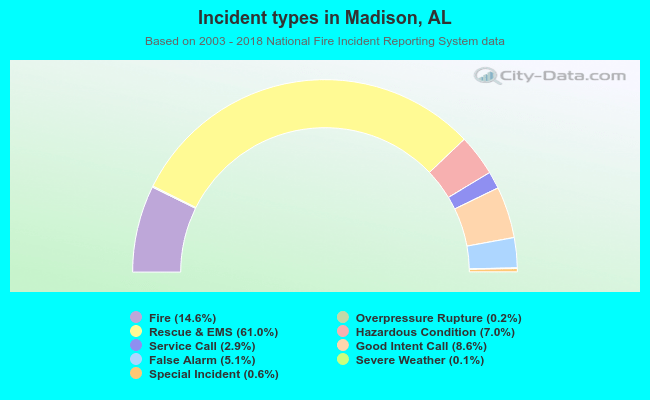 Out of all 10,831 cases reported during the years 2003 - 2018, the most belonged to the categories: Rescue & EMS (61.0%), Fire (14.6%), and Good Intent Call (8.6%).
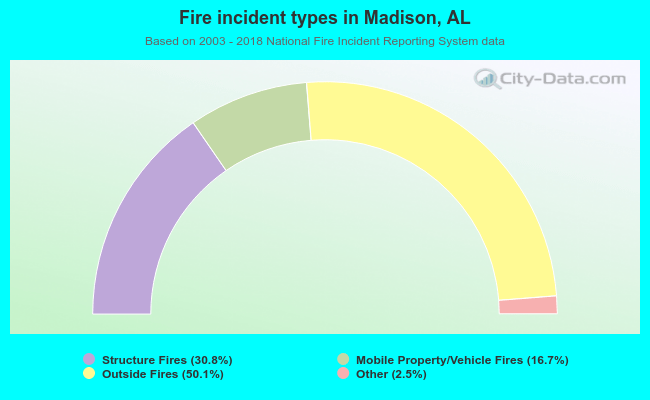 When looking into fire subcategories, the most reports belonged to: Outside Fires (50.1%), and Structure Fires (30.8%).