Madeira: Fire Incidents, Ohio (OH)
Where are fire incidents reported in Madeira, OH
Something went wrong! Please refresh the page.
|
| |||||||||||||||||||||||||||||||||||||||||||||||||||||||||||||||||||||||||||||||||||||||||||||||||||||||||||||
2002 - 2018 National Fire Incident Reporting System (NFIRS) incidents
- Incident types reported to NFIRS in Madeira, OH
- 99737.8%Rescue & EMS
- 59822.6%Hazardous Condition
- 33312.6%Good Intent Call
- 32212.2%False Alarm
- 2489.4%Fire
- 1194.5%Service Call
- 140.5%Severe Weather
- 80.3%Overpressure Rupture
- Fire incident types reported to NFIRS in Madeira, OH
- 14759.3%Structure Fires
- 5923.8%Outside Fires
- 3915.7%Mobile Property/Vehicle Fires
- 31.2%Other
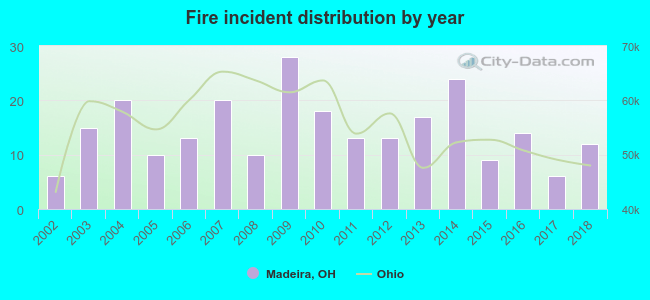 According to the data from the years 2002 - 2018 the average number of fire incidents per year is 15. The highest number of fires - 28 took place in 2009, and the least - 6 in 2002. The data has a rising trend.
The average number of yearly fire incidents per 10k residents in Madeira, OH compared to nearest cities:
(Note: Based on data for the last 3 years, including only cities with population 5,000 and above)
| Madeira: | 11.9 |
| Deer Park: | 26.9 |
| Blue Ash: | 53.8 |
| Montgomery: | 22.3 |
| Reading: | 56.7 |
| Milford: | 138.3 |
| Norwood: | 47.8 |
| Wyoming: | 21.0 |
| Sharonville: | 65.8 |

 According to the data from the years 2002 - 2018 the average number of fire-related casualties per year is 0. The highest number of casualties - 2 took place in 2004, and the lowest - 0 in 2002. The data has a constant trend.
 24.6% incidents where reported in the morning and 75.4% in the evening. The most fires (19.8%) took place on Sunday, and the least (9.3%) on Wednesday.
 Based on the 248 fires from years 2002 - 2018 most fires (14.1%) took place during June, and the least (4.0%) in September.
 Out of all 2,641 cases reported during the years 2002 - 2018, the most belonged to the categories: Rescue & EMS (37.8%), Hazardous Condition (22.6%), and Good Intent Call (12.6%).
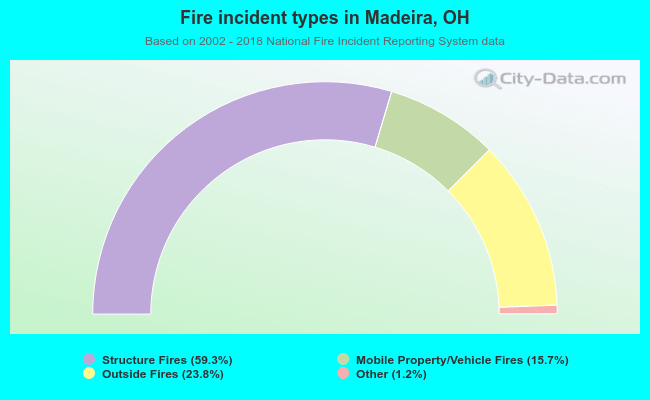 When looking into fire subcategories, the most incidents belonged to: Structure Fires (59.3%), and Outside Fires (23.8%).