Lomita: Fire Incidents, California (CA)
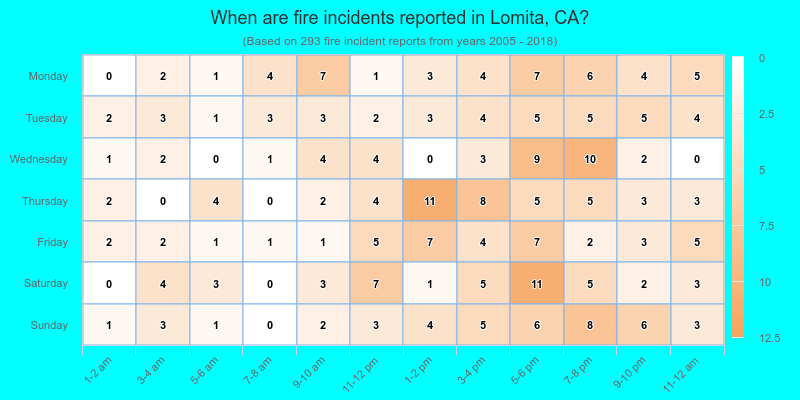
Where are fire incidents reported in Lomita, CA
Something went wrong! Please refresh the page.
|
| |||||||||||||||||||||||||||||||||||||||||||||||||||||||||||||||||||||||||||||||||||||||||||||||||||||||||||||
2005 - 2018 National Fire Incident Reporting System (NFIRS) incidents
- Incident types reported to NFIRS in Lomita, CA
- 4,78966.3%Rescue & EMS
- 1,22717.0%Good Intent Call
- 3494.8%False Alarm
- 2954.1%Service Call
- 2934.1%Fire
- 2553.5%Hazardous Condition
- Fire incident types reported to NFIRS in Lomita, CA
- 11037.5%Outside Fires
- 10937.2%Structure Fires
- 4916.7%Mobile Property/Vehicle Fires
- 258.5%Other
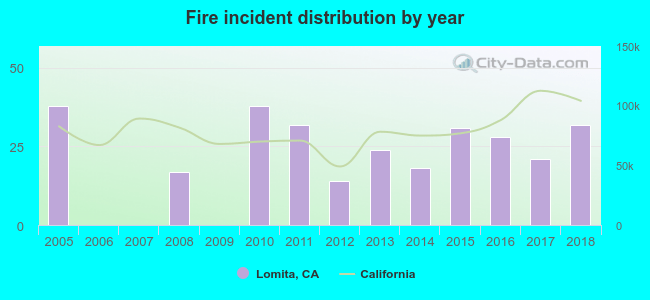 According to the data from the years 2005 - 2018 the average number of fires per year is 21. The highest number of fires - 38 took place in 2005, and the least - 0 in 2006. The data has a decreasing trend.
The average number of yearly fire incidents per 10k residents in Lomita, CA compared to nearest cities:
(Note: Based on data for the last 3 years, including only cities with population 5,000 and above)
| Lomita: | 13.0 |
| Torrance: | 13.1 |
| Rancho Palos Verdes: | 9.4 |
| Carson: | 21.2 |
| Redondo Beach: | 17.9 |
| Lawndale: | 14.3 |
| Gardena: | 27.7 |
| Hermosa Beach: | 8.2 |
| Manhattan Beach: | 13.8 |
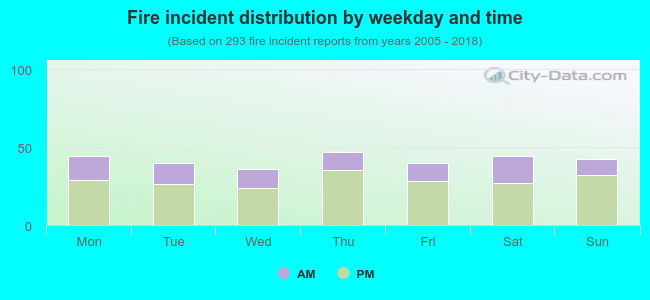 31.4% incidents where reported in the morning and 68.6% in the evening. The most fires (16.0%) took place on Thursday, and the least (12.3%) on Wednesday.
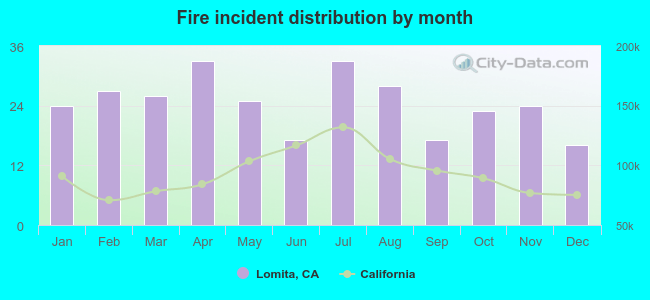 According to the 293 fire incident reports from years 2005 - 2018 most fires (11.3%) took place during April, and the least (5.5%) in December.
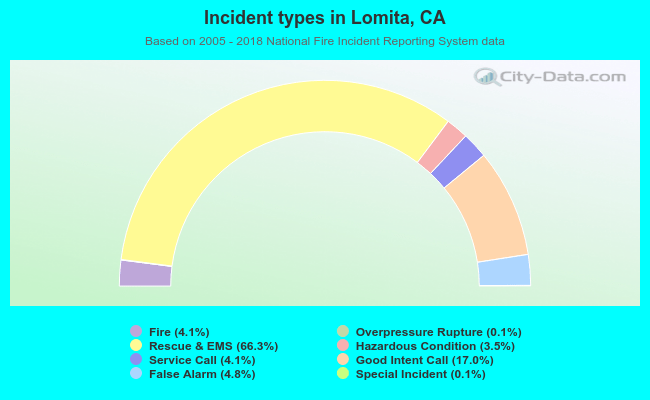 Out of all 7,218 cases reported during the years 2005 - 2018, the most belonged to the categories: Rescue & EMS (66.3%), Good Intent Call (17.0%), and False Alarm (4.8%).
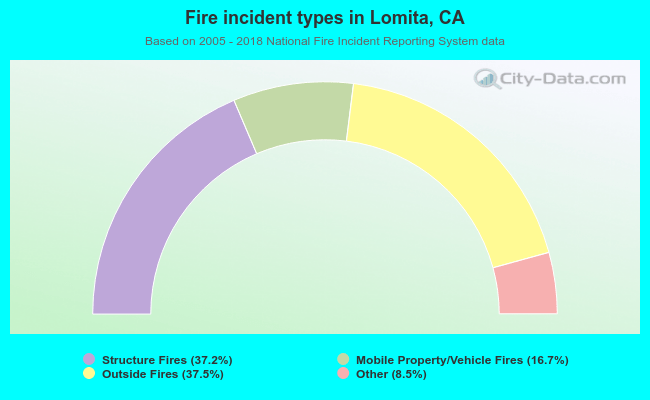 When looking into fire subcategories, the most incidents belonged to: Outside Fires (37.5%), and Structure Fires (37.2%).