Linden: Fire Incidents, New Jersey (NJ)
Where are fire incidents reported in Linden, NJ
Something went wrong! Please refresh the page.
| Fire incidents reported | |
|---|---|
| Sreet name | Count |
| W EDGAR RD | 148 |
| DILL AVE | 124 |
| EDGAR RD | 98 |
| WOOD AVE | 96 |
| N WOOD AVE | 90 |
| DILL AVE | 88 |
| S WOOD AVE | 84 |
| E EDGAR RD | 80 |
| S STILES ST | 62 |
| W ST GEORGES AVE | 56 |
| ELIZABETH AVE | 54 |
| W ELIZABETH AVE | 54 |
| N STILES ST | 52 |
| LOWER RD | 48 |
| W EDGAR RD | 48 |
| E LINDEN AVE | 44 |
| E ST GEORGES AVE | 42 |
| PARK AVE | 38 |
| ST GEORGES AVE | 38 |
| N WOOD AVE | 36 |
| STILES ST | 36 |
| E ELIZABETH AVE | 34 |
| W LINDEN AVE | 34 |
| BLANCKE ST | 32 |
| E BLANCKE ST | 32 |
| TURNPIKE NORTH BOUND LANES | 32 |
| TURNPIKE SOUTH BOUND LANES | 32 |
| ST GEORGE AVE | 30 |
| W BLANCKE ST | 28 |
| W ST GEORGES AVE | 28 |
| Other | 370 |
2002 - 2018 National Fire Incident Reporting System (NFIRS) incidents
- Incident types reported to NFIRS in Linden, NJ
- 19,13553.2%Rescue & EMS
- 7,23620.1%Hazardous Condition
- 3,2739.1%Service Call
- 2,9548.2%False Alarm
- 2,0685.7%Fire
- 1,2223.4%Good Intent Call
- 420.1%Overpressure Rupture
- 400.1%Special Incident
- Fire incident types reported to NFIRS in Linden, NJ
- 93645.3%Structure Fires
- 72034.8%Outside Fires
- 40619.6%Mobile Property/Vehicle Fires
- 60.3%Other
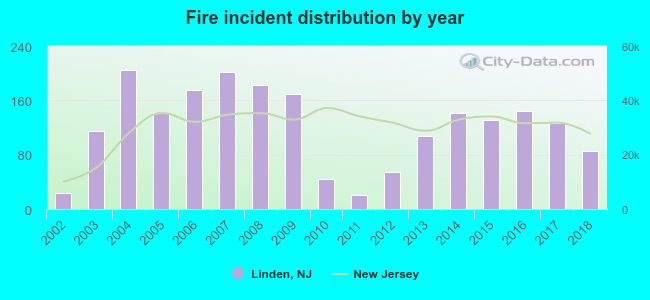 Based on the data from the years 2002 - 2018 the average number of fire incidents per year is 122. The highest number of fires - 204 took place in 2004, and the least - 20 in 2011. The data has a growing trend.
The average number of yearly fire incidents per 10k residents in Linden, NJ compared to nearest cities:
(Note: Based on data for the last 3 years, including only cities with population 5,000 and above)
| Linden: | 28.5 |
| Roselle: | 24.1 |
| Roselle Park: | 13.5 |
| Rahway: | 51.8 |
| Elizabeth: | 38.7 |
| Cranford: | 27.6 |
| Clark: | 30.3 |
| Kenilworth: | 14.3 |
| Carteret: | 24.1 |
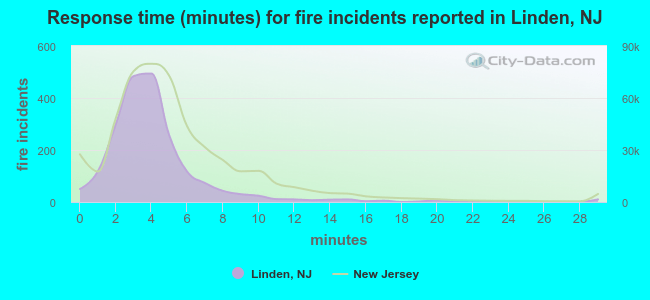 The median response time based on all reported fire incidents is 4 minutes. This is lower than the New Jersey median value.
The median response time in Linden, NJ compared to nearest cities:
(Note: Based on data for all years, including only cities with at least 500 fire incidents)
| Linden: | 4 minutes |
| Roselle: | 3 minutes |
| Rahway: | 3 minutes |
| Elizabeth: | 3 minutes |
| Cranford: | 4 minutes |
| Clark: | 6 minutes |
| Carteret: | 3 minutes |
| Avenel: | 4 minutes |
| Hillside: | 3 minutes |
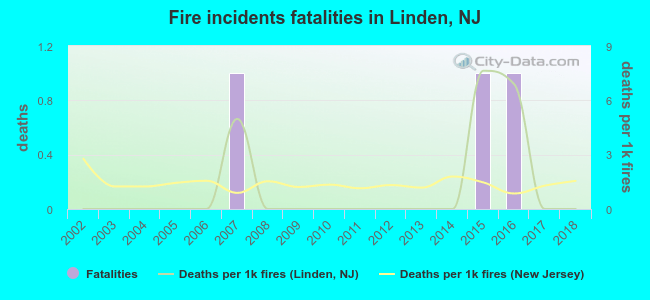 Based on the data from the years 2002 - 2018 the average number of fire-related yearly deaths is 0. The highest number of deaths - 1 took place in 2007, and the lowest - 0 in 2002. The data has a constant trend.
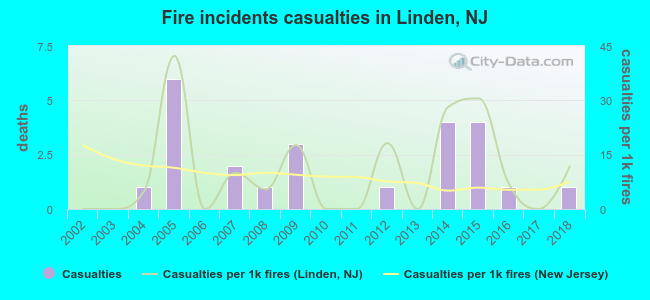 Based on the reports from the years 2002 - 2018 the average number of fire-related casualties per year is 1. The highest number of injuries - 6 took place in 2005, and the lowest - 0 in 2002. The data has an increasing trend.
The average number of casualties per 1,000 fire incidents is 10. This indicator was the highest - 42 in 2005, and the lowest 0 in 2002. The trend for injuries per 1,000 fire incidents is increasing. Compared to the New Jersey value the number of casualties per 1,000 fires is higher.
Based on the reports from the years 2002 - 2018 the average number of fire-related casualties per year is 1. The highest number of injuries - 6 took place in 2005, and the lowest - 0 in 2002. The data has an increasing trend.
The average number of casualties per 1,000 fire incidents is 10. This indicator was the highest - 42 in 2005, and the lowest 0 in 2002. The trend for injuries per 1,000 fire incidents is increasing. Compared to the New Jersey value the number of casualties per 1,000 fires is higher.
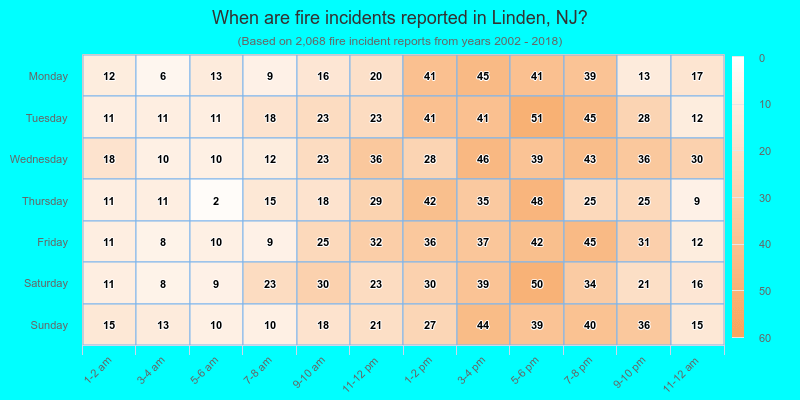
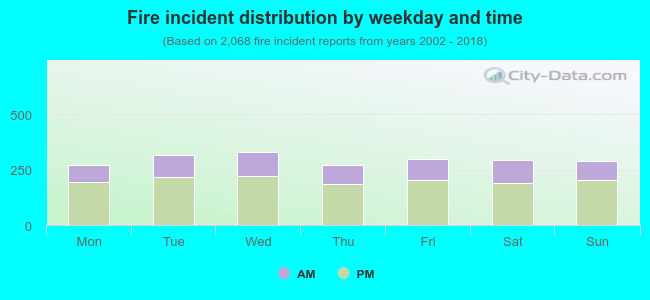 31.6% incidents where reported in the morning and 68.4% in the evening. The most fires (16.0%) took place on Wednesday, and the least (13.1%) on Thursday.
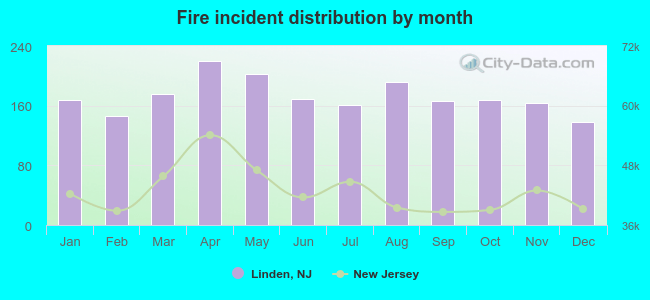 Based on the 2,068 incident reports from years 2002 - 2018 most fires (10.6%) took place during April, and the least (6.7%) in December.
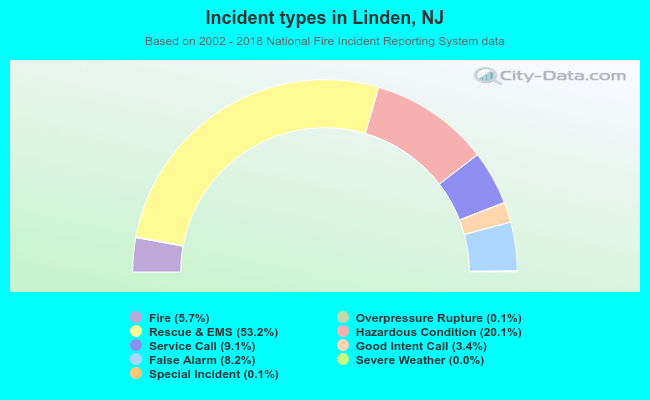 Out of all 35,981 cases reported during the years 2002 - 2018, the most belonged to the categories: Rescue & EMS (53.2%), Hazardous Condition (20.1%), and Service Call (9.1%).
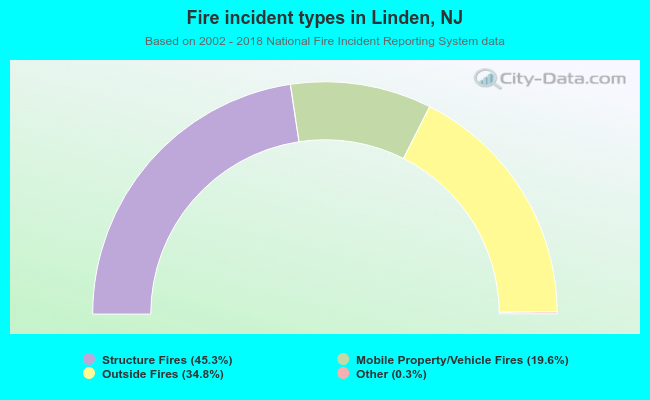 When looking into fire subcategories, the most reports belonged to: Structure Fires (45.3%), and Outside Fires (34.8%).