Leitchfield: Fire Incidents, Kentucky (KY)
Where are fire incidents reported in Leitchfield, KY
Something went wrong! Please refresh the page.
|
| |||||||||||||||||||||||||||||||||||||||||||||||||||||||||||||||||||||||||||||||||||||||||||||||||||||||||||||
| Other | 248 | |||||||||||||||||||||||||||||||||||||||||||||||||||||||||||||||||||||||||||||||||||||||||||||||||||||||||||||
2004 - 2018 National Fire Incident Reporting System (NFIRS) incidents
- Incident types reported to NFIRS in Leitchfield, KY
- 95832.1%Fire
- 85928.8%Rescue & EMS
- 50817.0%Hazardous Condition
- 2538.5%Service Call
- 2468.2%Good Intent Call
- 1464.9%False Alarm
- 140.5%Special Incident
- Fire incident types reported to NFIRS in Leitchfield, KY
- 39741.4%Outside Fires
- 33535.0%Structure Fires
- 17117.8%Mobile Property/Vehicle Fires
- 555.7%Other
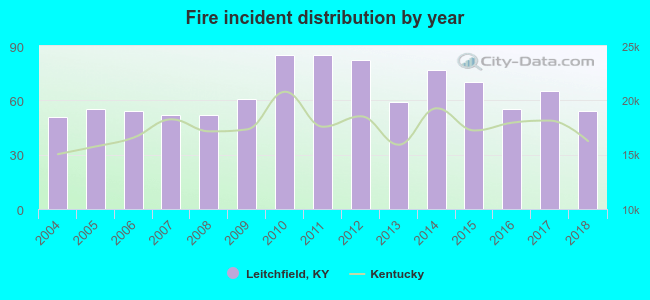 According to the data from the years 2004 - 2018 the average number of fires per year is 64. The highest number of fire incidents - 85 took place in 2010, and the least - 51 in 2004. The data has a rising trend.
The average number of yearly fire incidents per 10k residents in Leitchfield, KY compared to nearest cities:
(Note: Based on data for the last 3 years, including only cities with population 5,000 and above)
| Leitchfield: | 84.4 |
| Elizabethtown: | 49.7 |
| Vine Grove: | 62.3 |
| Radcliff: | 25.6 |
| Bowling Green: | 60.7 |
| Glasgow: | 123.7 |
 The median response time based on all reported fire incidents is 4 minutes. This is lower compared to the state median value.
The median response time in Leitchfield, KY compared to nearest cities:
(Note: Based on data for all years, including only cities with at least 500 fire incidents)
| Leitchfield: | 4 minutes |
| Elizabethtown: | 6 minutes |
| Vine Grove: | 9 minutes |
| Morgantown: | 16 minutes |
| Smiths Grove: | 12 minutes |
| Radcliff: | 5 minutes |
| Hodgenville: | 11 minutes |
| Bowling Green: | 6 minutes |
| Brandenburg: | 9 minutes |
 31.5% incidents where reported in the morning and 68.5% in the evening. The most fires (17.3%) took place on Wednesday, and the least (11.9%) on Monday.
 According to the 958 fires from years 2004 - 2018 most fires (11.3%) took place during March, and the least (6.1%) in May.
 Out of all 2,986 cases reported during the years 2004 - 2018, the most belonged to the categories: Fire (32.1%), Rescue & EMS (28.8%), and Hazardous Condition (17.0%).
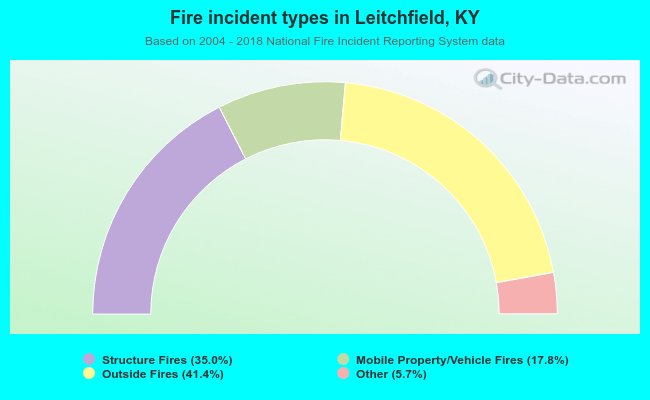 When looking into fire subcategories, the most incidents belonged to: Outside Fires (41.4%), and Structure Fires (35.0%).