Lehigh Acres: Fire Incidents, Florida (FL)
Where are fire incidents reported in Lehigh Acres, FL
Something went wrong! Please refresh the page.
| Fire incidents reported | |
|---|---|
| Sreet name | Count |
| LEE BLVD | 288 |
| HOMESTEAD RD | 218 |
| 5TH ST | 132 |
| 2ND ST | 122 |
| 12TH ST | 118 |
| SR 82 | 114 |
| 9TH ST | 112 |
| 13TH ST | 108 |
| 6TH ST | 108 |
| 10TH ST | 100 |
| 14TH ST | 98 |
| 7TH ST | 96 |
| SUNSHINE BLVD | 96 |
| 3RD ST | 92 |
| SHAWNEE RD | 92 |
| GUNNERY RD | 88 |
| 4TH ST | 86 |
| JOEL BLVD | 84 |
| 11TH ST | 82 |
| ALABAMA RD | 82 |
| RICHMOND AVE | 76 |
| MEADOW RD | 74 |
| 15TH ST | 72 |
| 8TH ST | 72 |
| 28TH ST | 68 |
| 29TH ST | 66 |
| BELL BLVD | 66 |
| 23RD ST | 62 |
| ROBERT AVE | 62 |
| 24TH ST | 60 |
| Other | 3,308 |
2002 - 2018 National Fire Incident Reporting System (NFIRS) incidents
- Incident types reported to NFIRS in Lehigh Acres, FL
- 38,75866.5%Rescue & EMS
- 6,30210.8%Fire
- 4,9808.5%Service Call
- 4,2687.3%Good Intent Call
- 2,3704.1%False Alarm
- 1,5762.7%Hazardous Condition
- Fire incident types reported to NFIRS in Lehigh Acres, FL
- 3,82660.7%Outside Fires
- 1,16218.4%Structure Fires
- 1,09317.3%Mobile Property/Vehicle Fires
- 2213.5%Other
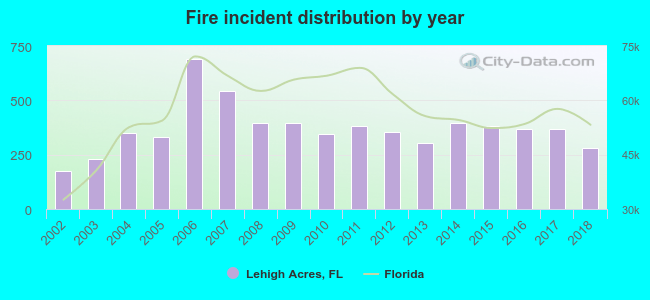 According to the data from the years 2002 - 2018 the average number of fires per year is 371. The highest number of fire incidents - 691 took place in 2006, and the least - 174 in 2002. The data has an increasing trend.
The average number of yearly fire incidents per 10k residents in Lehigh Acres, FL compared to nearest cities:
(Note: Based on data for the last 3 years, including only cities with population 5,000 and above)
| Lehigh Acres: | 39.2 |
| Gateway: | 1.2 |
| Fort Myers: | 97.1 |
| San Carlos Park: | 0.6 |
| Estero: | 26.8 |
| North Fort Myers: | 59.6 |
| La Belle: | 44.6 |
| Immokalee: | 49.8 |
| Bonita Springs: | 27.4 |
 The median response time based on all reported fire incidents is 7 minutes. This is comparable to the state median value.
The median response time in Lehigh Acres, FL compared to nearest cities:
(Note: Based on data for all years, including only cities with at least 500 fire incidents)
| Lehigh Acres: | 7 minutes |
| Alva: | 7 minutes |
| Fort Myers: | 5 minutes |
| Estero: | 6 minutes |
| North Fort Myers: | 6 minutes |
| La Belle: | 7 minutes |
| Immokalee: | 6 minutes |
| Bonita Springs: | 6 minutes |
| Cape Coral: | 6 minutes |
 According to the data from the years 2002 - 2018 the average number of fire-related yearly casualties is 4. The highest number of reported casualties - 10 took place in 2014, and the lowest - 0 in 2004. The data has a rising trend.
The average number of injuries per 1,000 fires is 12. This indicator was the highest - 30 in 2013, and the lowest 0 in 2004. The trend for casualties per 1,000 fire incidents is decreasing. Compared to the Florida value the number of casualties per 1,000 fire incidents is about the same.
According to the data from the years 2002 - 2018 the average number of fire-related yearly casualties is 4. The highest number of reported casualties - 10 took place in 2014, and the lowest - 0 in 2004. The data has a rising trend.
The average number of injuries per 1,000 fires is 12. This indicator was the highest - 30 in 2013, and the lowest 0 in 2004. The trend for casualties per 1,000 fire incidents is decreasing. Compared to the Florida value the number of casualties per 1,000 fire incidents is about the same.Casualties per 1,000 incidents in Lehigh Acres, FL compared to nearest cities:
(Note: Based on data for all years, including only cities with at least 500 fire incidents)
| Lehigh Acres: | 10.9 |
| Alva: | 7.9 |
| Fort Myers: | 15.4 |
| Estero: | 3.8 |
| North Fort Myers: | 7.1 |
| La Belle: | 3.9 |
| Immokalee: | 24.3 |
| Bonita Springs: | 5.2 |
| Cape Coral: | 13.1 |
 22.1% incidents where reported in the morning and 77.9% in the evening. The most fires (17.5%) took place on Saturday, and the least (12.6%) on Tuesday.
 Based on the 6,302 incident reports from years 2002 - 2018 most fires (15.1%) took place during April, and the least (5.4%) in September.
 Out of all 58,302 cases reported during the years 2002 - 2018, the most belonged to the categories: Rescue & EMS (66.5%), Fire (10.8%), and Service Call (8.5%).
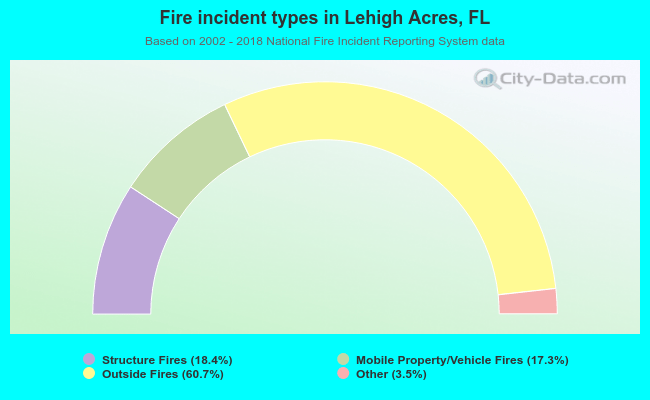 When looking into fire subcategories, the most reports belonged to: Outside Fires (60.7%), and Structure Fires (18.4%).