Laredo: Fire Incidents, Texas (TX)
Where are fire incidents reported in Laredo, TX
Something went wrong! Please refresh the page.
| Fire incidents reported | |
|---|---|
| Sreet name | Count |
| SAN BERNARDO AVE | 526 |
| SAN DARIO AVE | 496 |
| SAUNDERS ST | 346 |
| IH 35 HWY | 328 |
| HWY 359 | 326 |
| IH 35 | 316 |
| MCPHERSON RD | 310 |
| FM 1472 RD | 254 |
| MINES RD | 248 |
| US HIGHWAY 83 | 246 |
| STATE HIGHWAY 359 | 238 |
| ZAPATA HWY | 220 |
| DEL MAR BLVD | 200 |
| SANTA URSULA AVE | 200 |
| GUADALUPE ST | 198 |
| MEADOW AVE | 180 |
| LOOP 20 | 172 |
| SPRINGFIELD AVE | 170 |
| BARTLETT AVE | 166 |
| FM 1472 | 164 |
| EJIDO AVE | 160 |
| MONTERREY AVE | 154 |
| SANTA MARIA AVE | 148 |
| ARKANSAS AVE | 144 |
| CALTON RD | 142 |
| CLARK BLVD | 138 |
| SAN FRANCISCO AVE | 128 |
| CORPUS CHRISTI ST | 126 |
| MARKET ST | 126 |
| LYON ST | 122 |
| Other | 5,879 |
2002 - 2018 National Fire Incident Reporting System (NFIRS) incidents
- Incident types reported to NFIRS in Laredo, TX
- 127,31975.7%Rescue & EMS
- 12,5717.5%Fire
- 9,7255.8%Hazardous Condition
- 8,1474.8%False Alarm
- 7,7084.6%Good Intent Call
- 2,0961.2%Service Call
- 3150.2%Overpressure Rupture
- 2260.1%Special Incident
- Fire incident types reported to NFIRS in Laredo, TX
- 6,71553.4%Outside Fires
- 3,15025.1%Mobile Property/Vehicle Fires
- 2,31218.4%Structure Fires
- 3943.1%Other
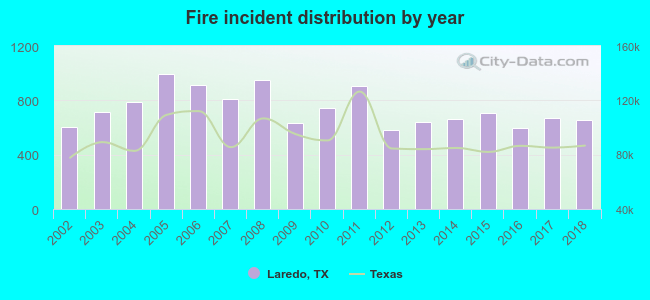 Based on the data from the years 2002 - 2018 the average number of fire incidents per year is 739. The highest number of fire incidents - 994 took place in 2005, and the least - 579 in 2012. The data has an increasing trend.
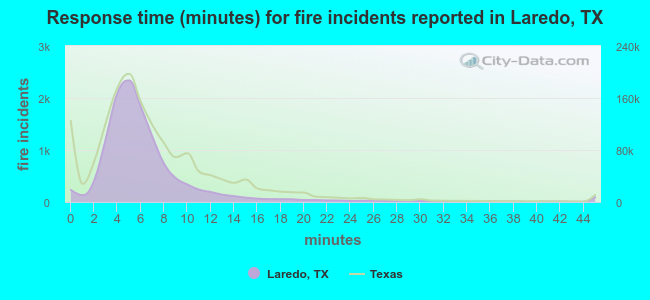 The median response time based on all reported fire incidents is 5 minutes. This is lower than the Texas median value.
The median response time in Laredo, TX compared to nearest cities:
(Note: Based on data for all years, including only cities with at least 500 fire incidents)
| Laredo: | 5 minutes |
| Cotulla: | 13 minutes |
 According to the reports from the years 2002 - 2018 the average number of fire-related yearly deaths is 1. The highest number of reported deaths - 7 took place in 2008, and the lowest - 0 in 2002. The data has a growing trend.
The average number of fatalities per 1,000 fires is 1. This indicator was the highest - 7 in 2008, and the lowest 0 in 2002. The trend for fatalities per 1,000 fire incidents is rising. Compared to the Texas value the number of deaths per 1,000 fire incidents is lower.
According to the reports from the years 2002 - 2018 the average number of fire-related yearly deaths is 1. The highest number of reported deaths - 7 took place in 2008, and the lowest - 0 in 2002. The data has a growing trend.
The average number of fatalities per 1,000 fires is 1. This indicator was the highest - 7 in 2008, and the lowest 0 in 2002. The trend for fatalities per 1,000 fire incidents is rising. Compared to the Texas value the number of deaths per 1,000 fire incidents is lower.Deaths per 1,000 incidents in Laredo, TX compared to nearest cities:
(Note: Based on data for all years, including only cities with at least 2,500 fire incidents)
| Laredo: | 1.3 |
 Based on the data from the years 2002 - 2018 the average number of fire-related casualties per year is 1. The highest number of reported injuries - 8 took place in 2008, and the lowest - 0 in 2002. The data has a growing trend.
The average number of casualties per 1,000 fire incidents is 2. This indicator was the highest - 8 in 2008, and the lowest 0 in 2002. The trend for casualties per 1,000 incidents is growing. Compared to the Texas value the number of casualties per 1,000 fires is much lower.
Based on the data from the years 2002 - 2018 the average number of fire-related casualties per year is 1. The highest number of reported injuries - 8 took place in 2008, and the lowest - 0 in 2002. The data has a growing trend.
The average number of casualties per 1,000 fire incidents is 2. This indicator was the highest - 8 in 2008, and the lowest 0 in 2002. The trend for casualties per 1,000 incidents is growing. Compared to the Texas value the number of casualties per 1,000 fires is much lower.Casualties per 1,000 incidents in Laredo, TX compared to nearest cities:
(Note: Based on data for all years, including only cities with at least 500 fire incidents)
| Laredo: | 2.0 |
| Cotulla: | 1.4 |
 29.9% incidents where reported in the morning and 70.1% in the evening. The most fires (15.1%) took place on Monday, and the least (13.7%) on Wednesday.
 According to the 12,571 fires from years 2002 - 2018 most fires (9.8%) took place during January, and the least (6.7%) in October.
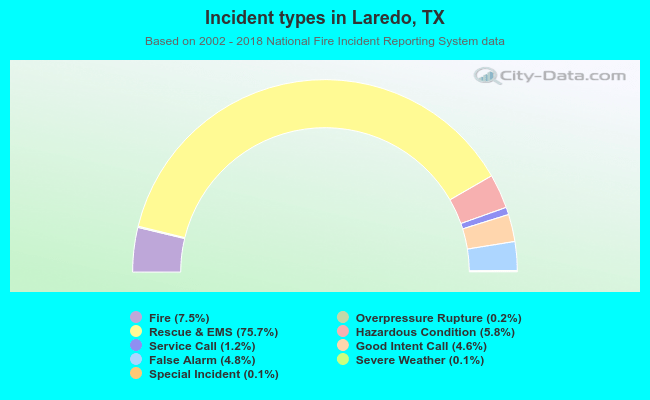 Out of all 168,238 cases reported during the years 2002 - 2018, the most belonged to the categories: Rescue & EMS (75.7%), Fire (7.5%), and Hazardous Condition (5.8%).
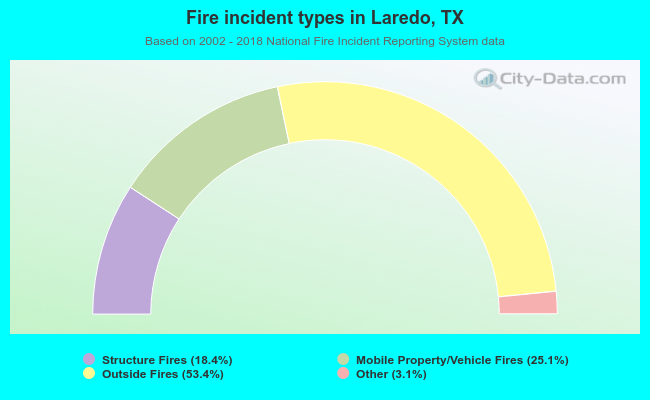 When looking into fire subcategories, the most reports belonged to: Outside Fires (53.4%), and Mobile Property/Vehicle Fires (25.1%).