Lakeway: Fire Incidents, Texas (TX)
Where are fire incidents reported in Lakeway, TX
Something went wrong! Please refresh the page.
|
| |||||||||||||||||||||||||||||||||||||||||||||||||||||||||||||||||||||||||||||||||||||||||||||||||||||||||||||
2004 - 2018 National Fire Incident Reporting System (NFIRS) incidents
- Incident types reported to NFIRS in Lakeway, TX
- 3,64767.1%Rescue & EMS
- 82315.1%Good Intent Call
- 3957.3%False Alarm
- 2875.3%Service Call
- 1643.0%Fire
- 901.7%Hazardous Condition
- 210.4%Special Incident
- Fire incident types reported to NFIRS in Lakeway, TX
- 6640.2%Structure Fires
- 6439.0%Outside Fires
- 1811.0%Mobile Property/Vehicle Fires
- 169.8%Other
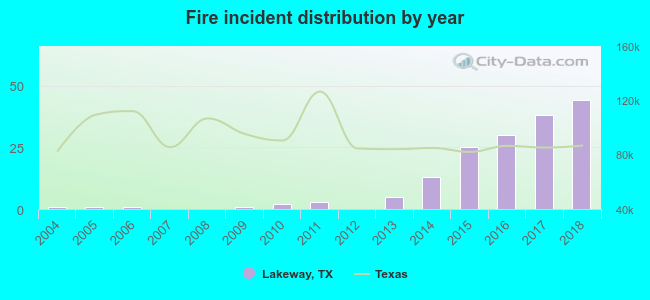 Based on the data from the years 2004 - 2018 the average number of fire incidents per year is 11. The highest number of reported fires - 44 took place in 2018, and the least - 0 in 2007. The data has a growing trend.
The average number of yearly fire incidents per 10k residents in Lakeway, TX compared to nearest cities:
(Note: Based on data for the last 3 years, including only cities with population 5,000 and above)
| Lakeway: | 27.3 |
| Bee Cave: | 21.8 |
| Lago Vista: | 47.3 |
| Cedar Park: | 18.8 |
| Jollyville: | 0.6 |
| Austin: | 17.6 |
| Leander: | 38.0 |
| Round Rock: | 17.3 |
| Buda: | 87.3 |
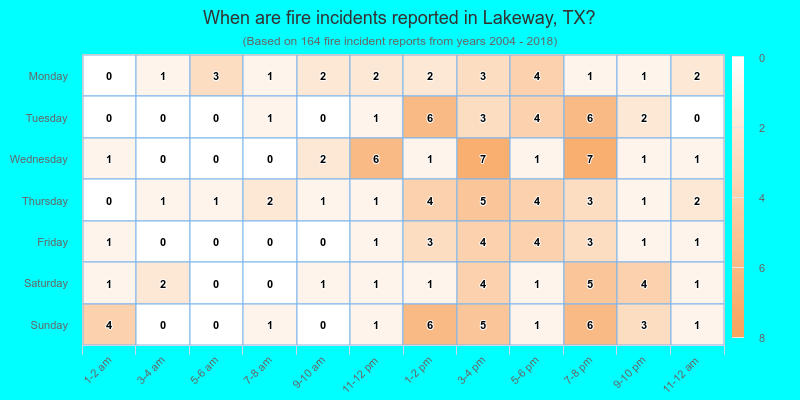
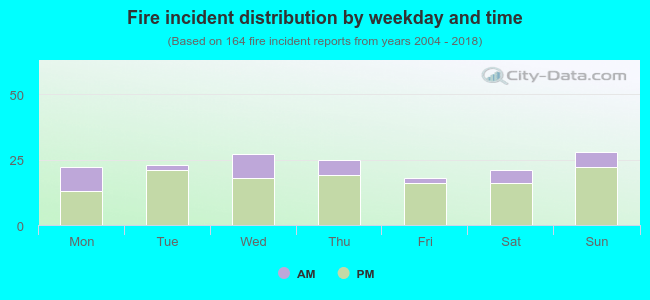 23.8% incidents where reported in the morning and 76.2% in the evening. The most fires (17.1%) took place on Sunday, and the least (11.0%) on Friday.
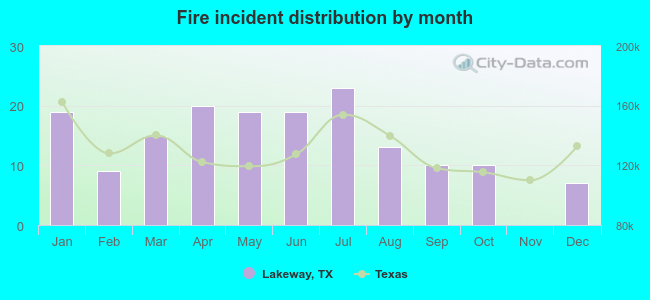 According to the 164 fire incident reports from years 2004 - 2018 most fires (14.0%) took place during July, and the least (0.0%) in November.
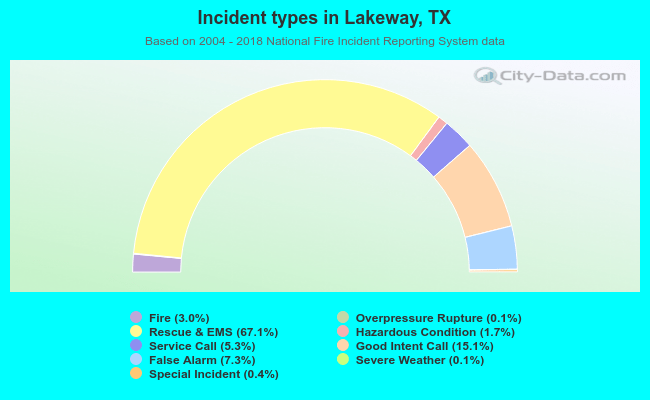 Out of all 5,435 cases reported during the years 2004 - 2018, the most belonged to the categories: Rescue & EMS (67.1%), Good Intent Call (15.1%), and False Alarm (7.3%).
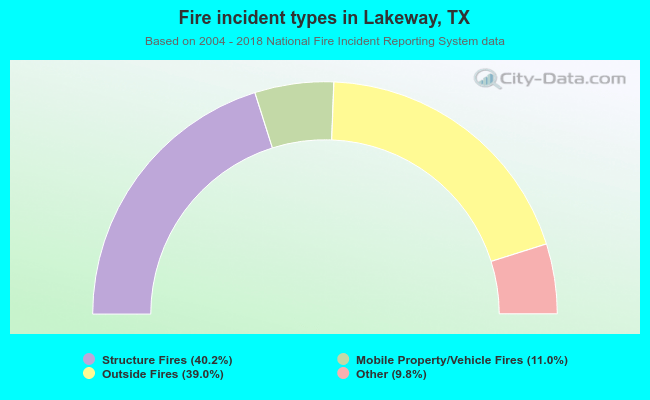 When looking into fire subcategories, the most reports belonged to: Structure Fires (40.2%), and Outside Fires (39.0%).