La Habra: Fire Incidents, California (CA)
Where are fire incidents reported in La Habra, CA
Something went wrong! Please refresh the page.
|
| |||||||||||||||||||||||||||||||||||||||||||||||||||||||||||||||||||||||||||||||||||||||||||||||||||||||||||||
2005 - 2018 National Fire Incident Reporting System (NFIRS) incidents
- Incident types reported to NFIRS in La Habra, CA
- 13,23469.7%Rescue & EMS
- 2,81714.8%Good Intent Call
- 1,0385.5%False Alarm
- 6783.6%Fire
- 6533.4%Service Call
- 4712.5%Hazardous Condition
- 820.4%Special Incident
- Fire incident types reported to NFIRS in La Habra, CA
- 28742.3%Outside Fires
- 20930.8%Structure Fires
- 12618.6%Mobile Property/Vehicle Fires
- 568.3%Other
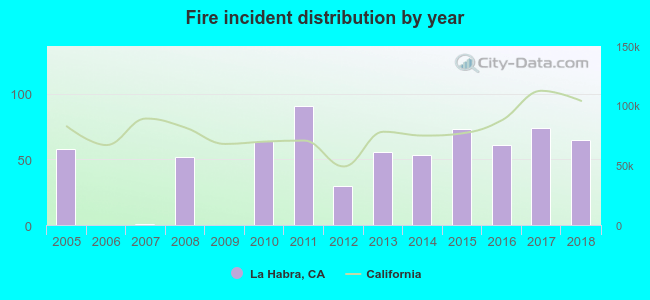 According to the data from the years 2005 - 2018 the average number of fires per year is 48. The highest number of fire incidents - 91 took place in 2011, and the least - 0 in 2006. The data has an increasing trend.
The average number of yearly fire incidents per 10k residents in La Habra, CA compared to nearest cities:
(Note: Based on data for the last 3 years, including only cities with population 5,000 and above)
| La Habra: | 10.7 |
| La Habra Heights: | 18.9 |
| Brea: | 14.2 |
| Fullerton: | 9.2 |
| La Mirada: | 7.6 |
| Whittier: | 11.9 |
| Hacienda Heights: | 11.5 |
| Rowland Heights: | 6.5 |
| Buena Park: | 14.2 |
 The median response time based on all reported fire incidents is 5 minutes. This is lower compared to the California median value.
The median response time in La Habra, CA compared to nearest cities:
(Note: Based on data for all years, including only cities with at least 500 fire incidents)
| La Habra: | 5 minutes |
| Fullerton: | 6 minutes |
| La Mirada: | 5 minutes |
| Whittier: | 4 minutes |
| Hacienda Heights: | 6 minutes |
| Buena Park: | 5 minutes |
| Industry: | 6 minutes |
| Placentia: | 5 minutes |
| Santa Fe Springs: | 7 minutes |
 32.9% incidents where reported in the morning and 67.1% in the evening. The most fires (15.6%) took place on Friday, and the least (12.7%) on Wednesday.
 According to the 678 reports from years 2005 - 2018 most fires (10.3%) took place during July, and the least (5.2%) in December.
 Out of all 18,990 cases reported during the years 2005 - 2018, the most belonged to the categories: Rescue & EMS (69.7%), Good Intent Call (14.8%), and False Alarm (5.5%).
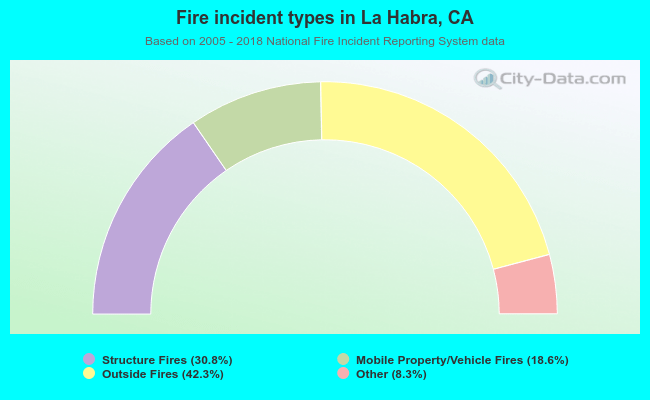 When looking into fire subcategories, the most incidents belonged to: Outside Fires (42.3%), and Structure Fires (30.8%).