Key West: Fire Incidents, Florida (FL)
Where are fire incidents reported in Key West, FL
Something went wrong! Please refresh the page.
| Fire incidents reported | |
|---|---|
| Sreet name | Count |
| ROOSEVELT BLVD | 604 |
| DUVAL ST | 258 |
| FLAGLER AVE | 116 |
| TRUMAN AVE | 104 |
| WHITE ST | 90 |
| SIMONTON ST | 82 |
| WHITEHEAD ST | 78 |
| FRONT ST | 64 |
| COLLEGE RD | 62 |
| DUCK AVE | 62 |
| ATLANTIC BLVD | 50 |
| KENNEDY DR | 48 |
| NORTHSIDE DR | 48 |
| OLIVIA ST | 38 |
| FLEMING ST | 36 |
| CATHERINE ST | 34 |
| MARGARET ST | 34 |
| EMMA ST | 32 |
| FIRST ST | 32 |
| PATTERSON AVE | 30 |
| SOUTHARD ST | 30 |
| THOMAS ST | 30 |
| WILLIAM ST | 30 |
| CAROLINE ST | 28 |
| EAGLE AVE | 28 |
| ELIZABETH ST | 28 |
| GRINNELL ST | 28 |
| EATON ST | 26 |
| FOURTEENTH ST | 26 |
| GOVERNMENT RD | 26 |
2002 - 2018 National Fire Incident Reporting System (NFIRS) incidents
- Incident types reported to NFIRS in Key West, FL
- 17,01757.4%Rescue & EMS
- 6,29321.2%Hazardous Condition
- 2,7079.1%False Alarm
- 1,6555.6%Fire
- 9673.3%Good Intent Call
- 9073.1%Service Call
- 590.2%Overpressure Rupture
- 490.2%Special Incident
- Fire incident types reported to NFIRS in Key West, FL
- 75545.6%Outside Fires
- 61637.2%Structure Fires
- 26516.0%Mobile Property/Vehicle Fires
- 191.1%Other
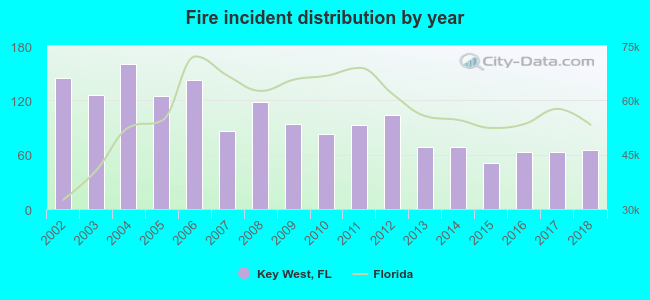 According to the data from the years 2002 - 2018 the average number of fires per year is 97. The highest number of reported fire incidents - 160 took place in 2004, and the least - 51 in 2015. The data has a dropping trend.
The average number of yearly fire incidents per 10k residents in Key West, FL compared to nearest cities:
(Note: Based on data for the last 3 years, including only cities with population 5,000 and above)
| Key West: | 24.8 |
| Marathon: | 26.8 |
| Islamorada: | 61.2 |
| Key Largo: | 39.9 |
| Marco Island: | 15.8 |
| Florida City: | 0.8 |
| Homestead: | 17.9 |
| Cutler Bay: | 13.9 |
| Palmetto Bay: | 9.5 |
 The median response time based on all reported fire incidents is 3 minutes. This is much lower compared to the Florida median value.
The median response time in Key West, FL compared to nearest cities:
(Note: Based on data for all years, including only cities with at least 500 fire incidents)
| Key West: | 3 minutes |
| Marathon: | 5 minutes |
| Islamorada: | 4 minutes |
| Key Largo: | 5 minutes |
| Marco Island: | 5 minutes |
| Homestead: | 6 minutes |
| Cutler Bay: | 6 minutes |
| Doral: | 6 minutes |
| Coral Gables: | 5 minutes |
 Based on the reports from the years 2002 - 2018 the average number of fire-related casualties per year is 0. The highest number of casualties - 4 took place in 2002, and the lowest - 0 in 2003. The data has a declining trend.
The average number of casualties per 1,000 fires is 4. This indicator was the highest - 28 in 2002, and the lowest 0 in 2003. The trend for casualties per 1,000 fire incidents is dropping. Compared to the Florida value the number of casualties per 1,000 fire incidents is much lower.
Based on the reports from the years 2002 - 2018 the average number of fire-related casualties per year is 0. The highest number of casualties - 4 took place in 2002, and the lowest - 0 in 2003. The data has a declining trend.
The average number of casualties per 1,000 fires is 4. This indicator was the highest - 28 in 2002, and the lowest 0 in 2003. The trend for casualties per 1,000 fire incidents is dropping. Compared to the Florida value the number of casualties per 1,000 fire incidents is much lower.Casualties per 1,000 incidents in Key West, FL compared to nearest cities:
(Note: Based on data for all years, including only cities with at least 500 fire incidents)
| Key West: | 4.8 |
| Marathon: | 8.3 |
| Islamorada: | 8.2 |
| Key Largo: | 7.6 |
| Marco Island: | 10.9 |
| Homestead: | 0.0 |
| Cutler Bay: | 0.0 |
| Doral: | 0.0 |
| Coral Gables: | 3.2 |
 34.6% incidents where reported in the morning and 65.4% in the evening. The most fires (14.9%) took place on Thursday, and the least (13.2%) on Friday.
 Based on the 1,655 fire incident reports from years 2002 - 2018 most fires (11.4%) took place during January, and the least (4.9%) in September.
 Out of all 29,657 cases reported during the years 2002 - 2018, the most belonged to the categories: Rescue & EMS (57.4%), Hazardous Condition (21.2%), and False Alarm (9.1%).
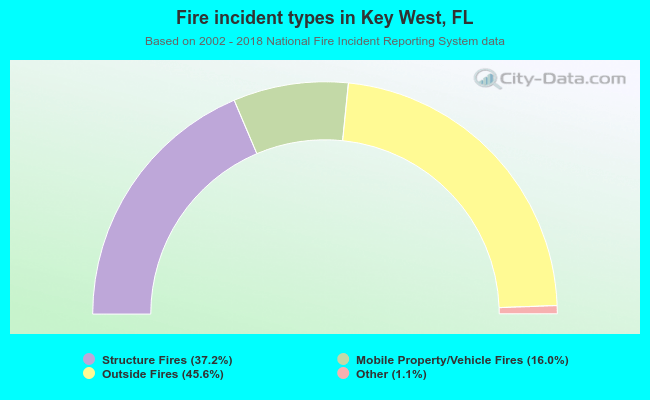 When looking into fire subcategories, the most reports belonged to: Outside Fires (45.6%), and Structure Fires (37.2%).